
The ongoing tensions in the Middle East are making waves across global markets, impacting both stocks and cryptocurrencies as highlighted by World Of Charts, an analyst. Among the cryptocurrencies affected, Bitcoin (BTC) is currently testing a crucial area within a broadening wedge pattern. This technical setup could lead to significant price movements in the near future.
As of press time, Bitcoin is trading at $51,399, having dropped by 15.43% in the last 24 hours. The price is navigating through a descending channel, reflecting a bearish trend. This movement comes amid a backdrop of global economic uncertainties, which are contributing to the current market volatility.
Bitcoin and Ethereum Plunge: The Time to Buy the Dip?The key levels to watch on Bitcoin’s chart are critical in assessing potential future movements. The upper trendline of the broadening wedge, around $67,000, represents a significant resistance level. This is where Bitcoin has faced selling pressure in recent weeks. Another resistance level to keep in mind is near $75,000, which has historically been a challenging barrier for Bitcoin to overcome.
On the support side, the lower trendline around $45,000 acts as a major floor for the price. Recent price action has tested this support level, highlighting its importance. Additionally, there is an intermediate support level near $51,000, which has shown relevance in recent market movements.
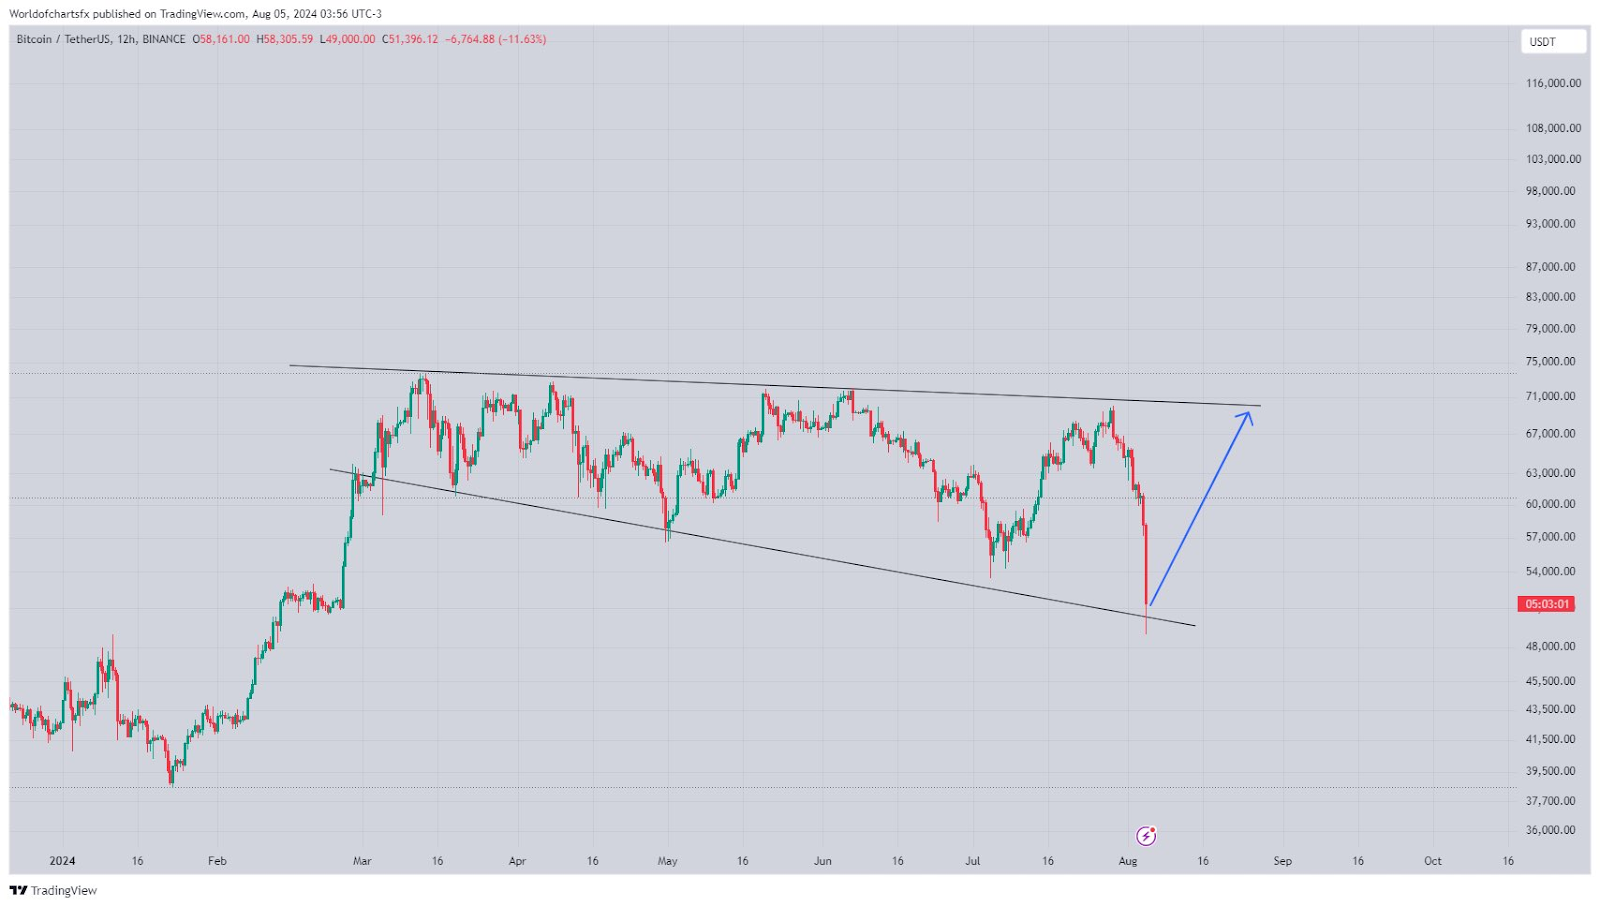
The current bearish trend suggests that Bitcoin might continue to test these support levels. However, if the price manages to hold above $45,000, a potential rebound towards the upper resistance at $67,000 could be on the horizon. A breakout above this upper trendline could signal a shift towards a bullish trend, marking a significant change in market sentiment.
Further analysis by Ali Martinez, the Bitcoin MVRV Ratio (30D) has reached its lowest point since November 2022, right after the FTX collapse. This historical low could indicate a bottoming phase, suggesting that current levels may present a strong buying opportunity for investors.
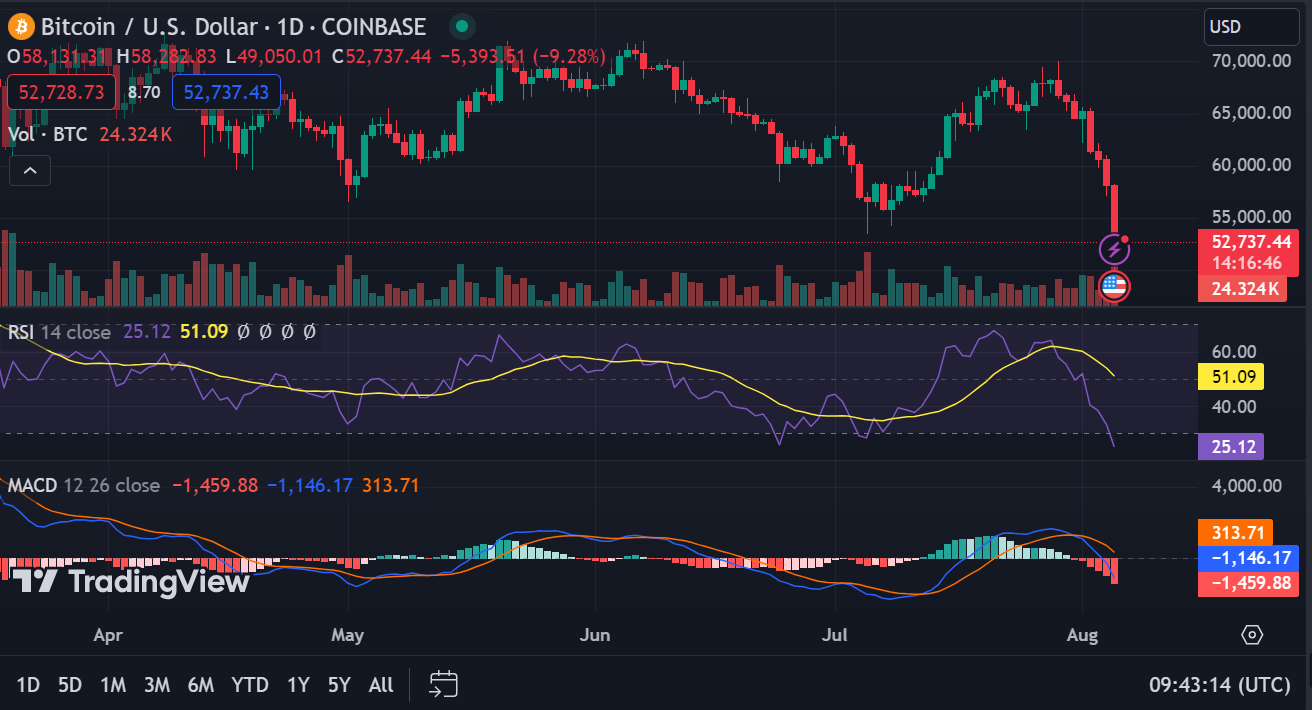
The 1-day Relative Strength Index (RSI) reads 25.12, signaling that Bitcoin is currently oversold. This could imply that a price reversal might be imminent.
However, the 1-day MACD trading below the signal line indicates that bearish momentum remains strong for now.