ADA Near Breakdown as Bearish Signals Strengthen at Support

- ADA trades below key averages as a bearish pennant keeps downside pressure active
- RSI near the 40 mark signals weak demand while sellers defend overhead resistance
- A break below the $0.37 support range risks acceleration toward the $0.32 November low
Cardano is slipping deeper into a bearish phase as price continues to struggle beneath key technical levels. While the market has not seen a sharp breakdown yet, the overall setup still favors sellers, especially when viewed across higher timeframes.
At press time, ADA was trading around $0.4022, down 0.08% over the last 24 hours. Although the daily move appears modest, it follows a broader slide that has seen ADA lose roughly 8% over the past week and about 22% over the last month. The cumulative effect has kept the token entrenched below key technical thresholds.
Bearish Pennant Pattern Reinforces Downtrend
Looking at the daily chart, Cardano is forming what appears to be a bearish pennant. This pattern developed after a strong downside move and usually reflects a bearish pause rather than a reversal. This is evident as ADA’s price is compressing beneath descending resistance while forming higher lows, indicating consolidation rather than recovery.
Another concern is trend positioning. All major moving averages are above the current price, which keeps pressure on any bounce. The 7-day and 30-day moving averages sit near $0.42, and the Cardano price has failed to reclaim that zone multiple times. Each push higher has been sold into fairly quickly.
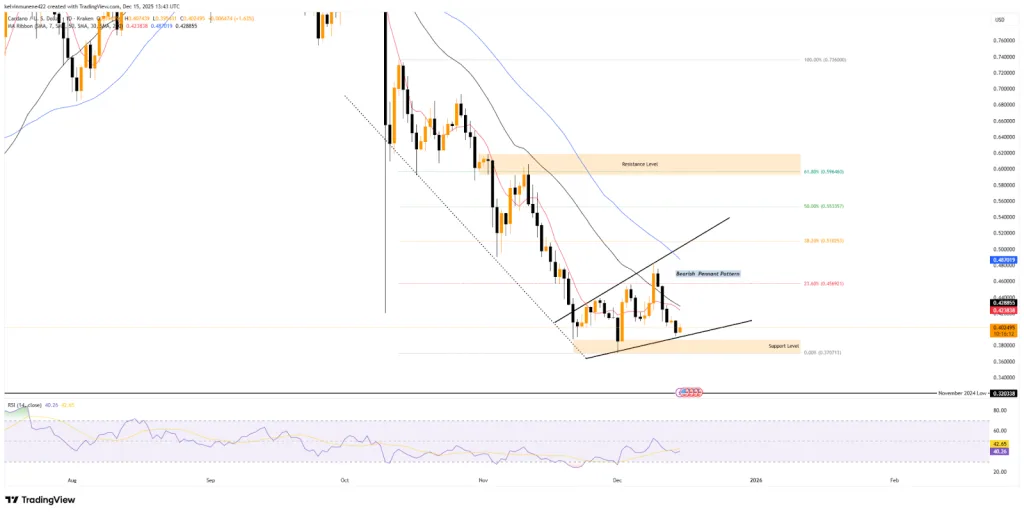
Fibonacci retracement levels further reinforce the challenge facing buyers. The 23.60% retracement at $0.45 and the 38.20% level near the $0.51 line up closely with the upper boundary of the pennant. Both levels have already acted as barriers. Until the price can break and hold above them, the bearish structure remains intact.
However, if that structure were to break, the technical outlook would change to bullish. In that case, attention would shift toward the 50% Fibonacci retracement, followed by the 61.80% level, which sits in the $0.59 to $0.61 range. That area capped price action from late October through mid-November. For now, it remains distant resistance.
Momentum Remains Skewed to Sellers
Indicator momentum is not helping the bullish case either. The RSI is sitting near 40, below the neutral midpoint. Earlier attempts to move back above 50 were rejected, which suggests buyers lack conviction. As long as RSI stays in this range, sellers remain in control.
Such a sentiment hints at a potential downside target, with traders watching the $0.37 to $0.38 support zone closely. This area has held during previous pullbacks. A loss of that range would likely expose Cardano to a deeper move toward the November 2024 low around $0.32, which stands out as the next major downside reference.
Despite the weak structure, activity in the market has increased. 24-hour trading volume has risen to $511.91 million, up 24.12%. Rising volume during consolidation usually signals positioning rather than confidence. Traders appear to be preparing for volatility rather than betting on a clear direction.
Related: BONK Price Bounces Off Support at $0.0000089: Is $0.00001 Next?
Leverage Data and Analyst Views Suggest Caution
Liquidation data adds another layer to the risk. The liquidation heatmap shows over $1.14 million in short-side liquidation leverage, meaning a large portion of traders are positioned long. If price moves lower, those positions could be forced to close, potentially accelerating downside moves.
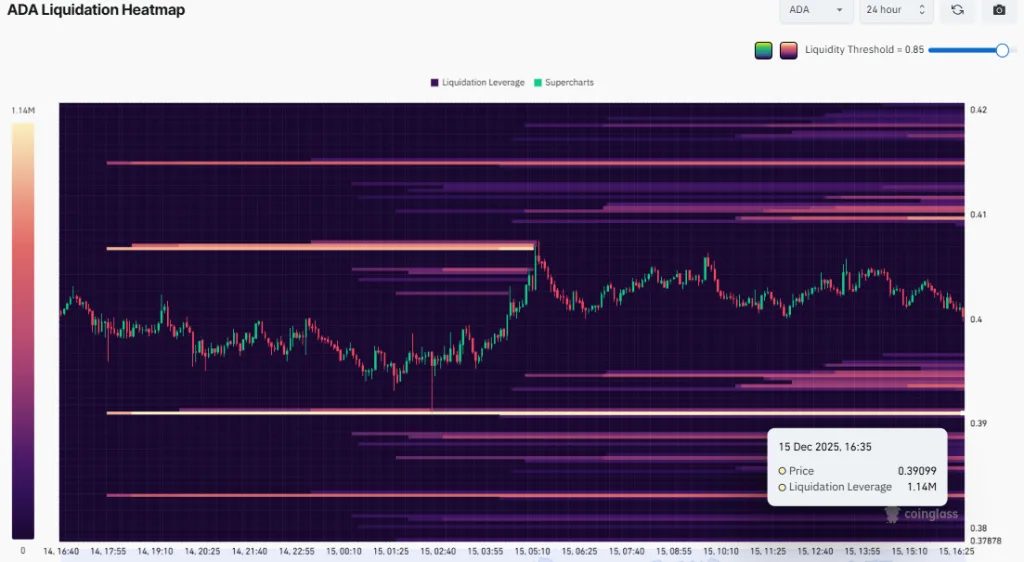
Such liquidity clusters often act as price magnets. As ADA approaches these zones, volatility tends to increase, potentially triggering rapid sell-offs or cascading liquidations. These areas can also behave as hidden support or resistance. A sharp rejection may confirm the zone’s strength, while a clean break could fuel accelerated downside continuation.
Meanwhile, analyst Ali Martinez highlighted a historical reference that traders are paying attention to. He noted that during the last bearish flip of Cardano’s SuperTrend indicator, ADA went on to lose nearly 80% of its value.
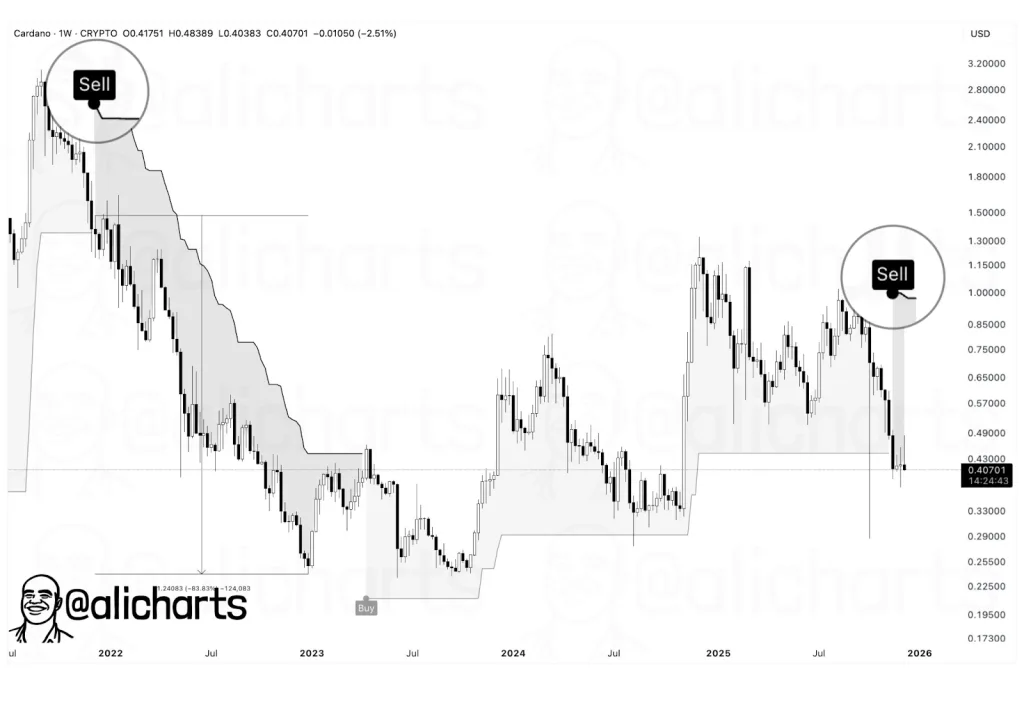
According to his latest assessment, a similar technical setup has started to appear again. If price behavior follows the same trajectory, Cardano could face another steep drawdown approaching that magnitude.
However, for now, Cardano remains under resistance, momentum favors sellers, and liquidity data suggests downside sensitivity. With volume rising and price compressing, the next move is likely approaching. Whether support holds or gives way will shape ADA’s short-term direction.