
The latest Algorand price analysis confirms that a bullish trend has dominated the charts for the past few days. Today, we can see strong support at $0.29 at the time of writing. If the price falls below this level, it will likely find support at $0.50. If the price manages to break above the resistance, it will likely be $0.60.
The price managed to break out of this trendline last week and has since been on an upward trend. However, it has faced some resistance at $0.50 and has been unable to sustain itself above this level. For now, it seems like the price is consolidating around $0.40, and we may see a breakout in either direction in the coming days.
The Algorand price analysis shows that the bulls currently control the market. They need to break above the $0.50 resistance level to confirm dominance. If e bears take control, we may see a move back down to $0.29 support.
ALGO/USD pair is currently trading at $0.39, and the price may consolidate around this level for some time. The Algorand price analysis shows that the bulls control the market. They must break above the $0.50 resistance level to confirm their dominance. We may see a move towards $0.60 soon if they can do so.
ALGO/USD 1-day Price Chart: Algorand Trades Positively
The 1-day price chart for Algorand price analysis shows a bullish trend. The price has been following a descending trendline since mid-September. However, it managed to break out of this trendline last week and has been on an upward trend since then.

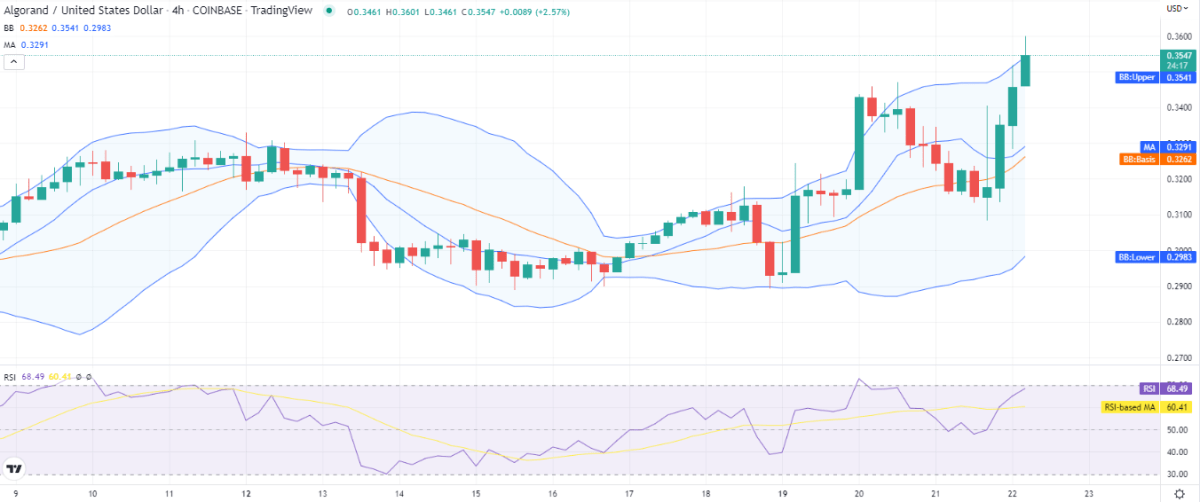
ALGO/USD is currently experiencing high volatility as the market is indecisive about the future direction of the price. The upper Bollinger band value is $0.354, and the lower Bollinger band value is $0.298. The RSI score is in the neutral zone but on an upwards curve, at index 68, which is quite near the overbought limit, indicating the buying activity in the market.
Algorand Price Analysis: Recent Developments and Further Technical Indications
The four hours Algorand price analysis shows signs of a solid bullish trend as the market gears up for more upside. The cryptocurrency has followed an ascending trendline since mid-September and has made higher highs and higher lows throughout this period.
The MACD indicator is currently in the bullish zone and indicates momentum upwards. The signal line is also above the MACD line, confirming the bullish trend. The Algorand price analysis shows that the bulls currently control the market.
Algorand price analysis conclusion
In conclusion, the Algorand price analysis shows that the bulls are currently in control of the market. However, the price is facing some resistance at $0.50, and it remains to be seen if it can break out of this level. In the meantime, we can expect the price to remain volatile with a lot of upside potential.