Altcoins Lead Q3 2025 Crypto Performance, Outpacing Bitcoin

- Altcoins outpaced Bitcoin in Q3, fueled by stablecoin growth and exchange activity.
- Bitcoin’s market cap surged from last year as public companies hold over 1M BTC.
- Ethereum’s market cap rose with DeFi, NFTs, and ETH 2.0 driving adoption and growth.
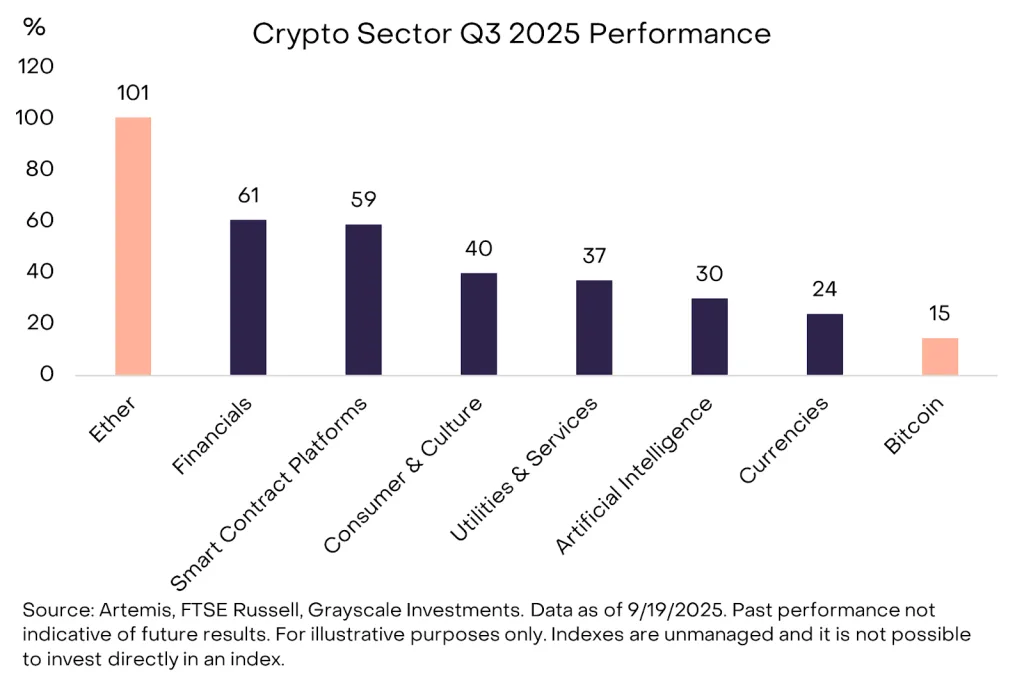
The third quarter of 2025 marked a period of strength across all six crypto sectors tracked by Grayscale Research and FTSE/Russell. Each segment recorded positive price returns, contributing to the combined $3.5 trillion market capitalization of 261 tokens covered by the framework. The six crypto sectors are currencies, smart contract platforms, financials, consumer & culture, artificial intelligence, and utilities & services.
Despite these gains, fundamentals showed mixed signals. Active users, transactions, and fees fell in the Currencies and Smart Contract Platforms segments. At the same time, blockchain-based applications generated a 28% increase in fee revenue, led by platforms such as Jupiter, Aave, and Hyperliquid.
Altcoins Dominated Q3 Performance
According to Grayscale Research’s index, altcoins drove the best volatility-adjusted returns. BNB Chain topped the ranking of the top 20 performing tokens, combining substantial gains with relative stability. Prometeus, Avalanche, Cronos, Beldex, and Ethereum followed closely.
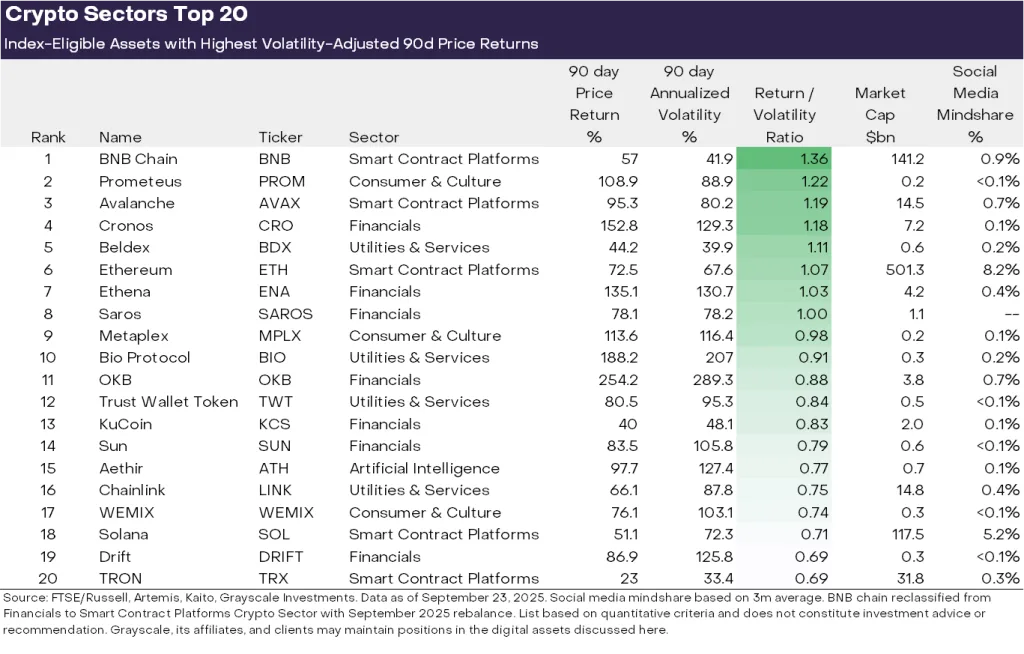
The list revealed a shift in market leadership. Seven of the top 20 assets came from the Financials sector, while five belonged to Smart Contract Platforms. This composition highlighted a stronger demand for utility-driven platforms and financial services. Notably, Bitcoin did not cut, reflecting weaker risk-adjusted returns compared with peers.
Why Bitcoin Lagged Behind
Bitcoin underperformed during the quarter as the Currencies sector delivered the lowest relative gains. While Bitcoin’s price advanced modestly, it did not benefit from thematic catalysts driving other assets. The asset’s role as a store of value and peer-to-peer cash left it less exposed to adoption narratives shaping the broader market.
By contrast, tokens tied to rising centralized exchange volumes, such as BNB and CRO, and to stablecoin adoption, including Ethereum, Solana, and Avalanche, performed strongly. DATs also influenced token demand, particularly for assets held by public companies as treasury reserves.
Key Market Drivers
Stablecoin Adoption and Regulation
The GENIUS Act, signed into law in July, created a regulatory framework for stablecoins in the United States. Following its passage, stablecoin supply grew 16% to more than $290 billion. Platforms like Ethereum, TRON, and Avalanche saw increased transaction activity, while issuer Ethena recorded strong returns despite regulatory limitations on its flagship stablecoin.
Centralized and Decentralized Exchange Growth
In August, centralized exchanges recorded their highest trading volumes of the year. This activity supported tokens tied to major exchanges, including BNB, CRO, OKB, and KCS. At the same time, decentralized perpetual futures protocols advanced. Hyperliquid became a top-three revenue generator, while Drift and ASTER posted rapid growth.
Crypto Market Cap Growth Overview
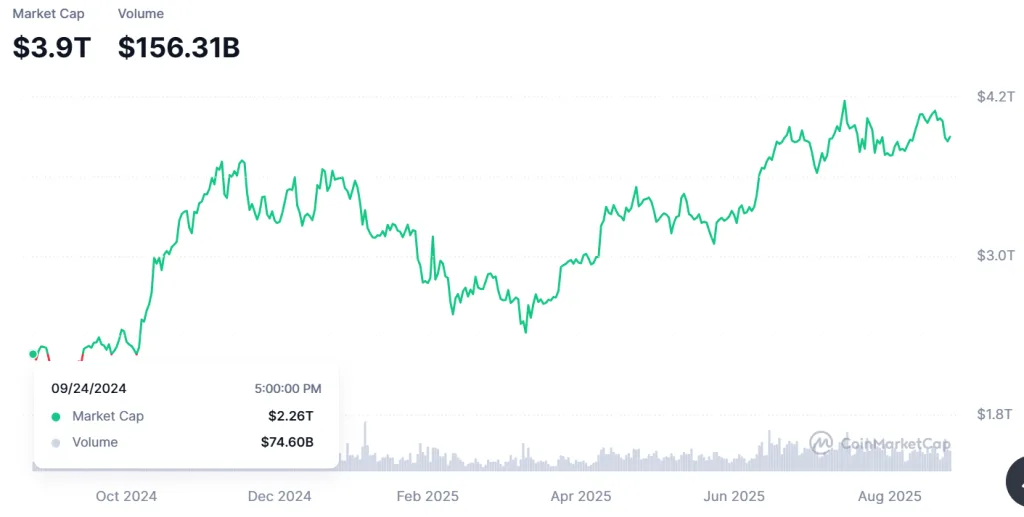
The cryptocurrency market saw remarkable growth between 2024 and 2025. The total market cap rose from $2.26 trillion in September 2024 to a high of $4.1 trillion by September 2025. This significant increase indicates strong investor interest, with both institutional and retail participation growing steadily.
Bitcoin continues to dominate the market, accounting for approximately 58% of the total market cap, reaching a market cap of $2.26 trillion by September 2025. Ethereum, with its involvement in decentralized finance and NFTs, follows Bitcoin with a market cap of $501.27 billion, which represents roughly 12.5% of the total market cap.
Bitcoin Price and Market Cap Growth from 2024 to 2025
Bitcoin has been one of the leading cryptocurrencies behind market growth, with substantial increases in both price and market capitalization. Bitcoin’s market cap rose from $1.27 trillion in September 2024 to $2.26 trillion in 2025.
Bitcoin’s all-time high was $124,457, reached on August 13, 2025, and its yearly low was $58,895.21, reached on October 3, 2024.
Its price also shows significant growth, with the current price at $113,113.79 as of September 2025, representing a 75.68% year-on-year increase. These fluctuations mirror a volatile market that is still experiencing ups and downs, but Bitcoin still holds its ground as the market leader.
Bitcoin currently dominates the market at 57.8%, showing steady strength after rebounding from near its yearly low of 53.9% in December 2024. However, it still remains below the yearly high of 65.1% in June 2025. Ethereum has decreased to 12.9%, while others collectively hold 29.3%, staying within their range.
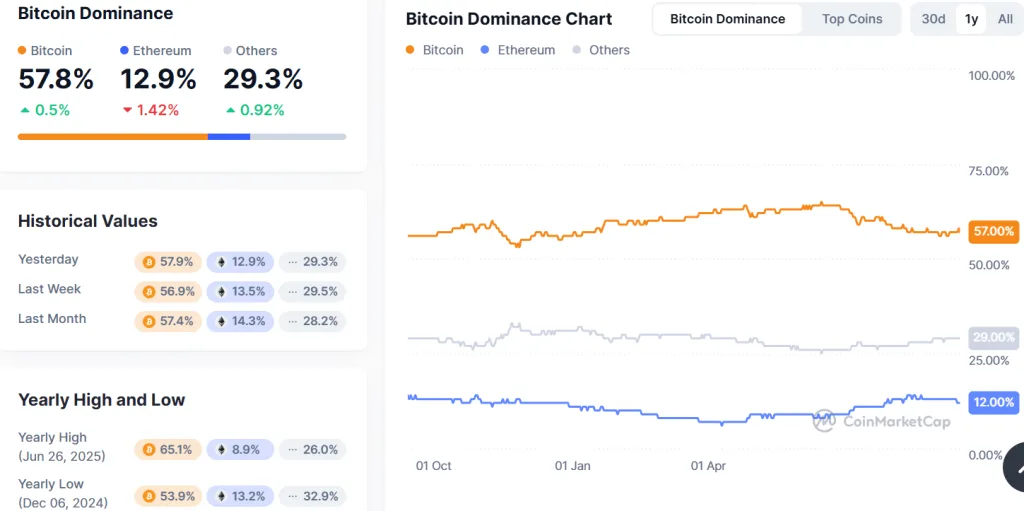
The one-year chart shows Bitcoin maintaining stability above 50%, Ethereum on a slow decline, and altcoins fluctuating as capital shifts, reinforcing Bitcoin’s role as the market anchor.
The CMC Crypto Fear and Greed Index reached a yearly high of 88 (Extreme Greed) on November 20, 2024, when Bitcoin prices surged above 95K USD, reflecting strong optimism and FOMO-driven sentiment. Conversely, the yearly low was 15 (Extreme Fear) on March 10, 2025, during a sharp market correction with Bitcoin price dropping below $78,000, highlighting panic and heavy selling pressure.
Bitcoin Holdings by Public Companies
Public companies own a large portion of the overall Bitcoin supply, signalling the increasing institutional interest in the asset. As of September 2025, public companies hold about 1 million Bitcoin, which represents 4.94% of the total Bitcoin supply. The majority of these holdings are in the hands of U.S.-based companies, which together hold 90.8% of the corporate Bitcoin reserves.
According to bitcointreasuries.net, the top companies holding the most Bitcoin are headed by Strategy (MSTR), with a significant 639,835 BTC, and Marra Holdings, Inc. (MARA), holding 52,477 BTC in second place. In third place is XXI, with 43,514 BTC, while Bitcoin Standard Treasury Company (CEPO) has 30,021 BTC. Metaplanet Inc. (MTPLF), headquartered in Japan, is next in line with 25,555 BTC, and Bullish is next with 24,300 BTC.
Other notable companies that own Bitcoin include Riot Platforms, Inc. (RIOT), Trump Media & Technology Group (DJT), CleanSpark, Inc. (CLSK), Coinbase Global, Inc. (COIN), Tesla, Inc. (TSLA), Hut 8 Mining Corp (HUT), Block, Inc. (XYZ), GD Culture Group (GDC), and Galaxy Digital Holdings Ltd (GLXY). These companies further demonstrate the extent of growing institutional and corporate involvement in the Bitcoin market.
Ethereum Price and Market Cap Growth from 2024 to 2025
Ethereum has also experienced remarkable growth, with its market cap rising from about $319.38 billion in September 2024 to $501.27 billion in September 2025. Being the lead in smart contracts and decentralized finance (DeFi) network, its NFT market share has enabled it to have a notable share of the entire market cap, estimated at 12.9% in September 2025.
The price of Ethereum hit an all-time high of $4,953 on August 24th, 2025. Continuous technological upgrades to the platform, such as Ethereum 2.0, have also enhanced its scalability and sustainability, further contributing to its value.
Ethereum’s price explosion can also be attributed to the growth in the adoption of sectors such as decentralized applications (DApps) and NFTs, which have become an essential part of the cryptocurrency ecosystem.
Stablecoins Market Cap Growth from 2024 to 2025
Stablecoins are growing in importance in the cryptocurrency ecosystem. As of September 2025, their market cap amounts to over $295. This growth represents the increasing use cases of stablecoins, especially for transactions and decentralized finance (DeFi).
The stability of stablecoins like Tether (USDT) and USD Coin (USDC) continues to make them vital for providing liquidity and reducing the volatility that is often associated with other cryptocurrencies. Their role in cross-border transactions and integration with DeFi protocols is on a steady rise, cementing their position in the evolving market.
Altcoins Market Cap Growth from 2024 to 2025
By September 2025, the market cap of alytcoins reached $865.99 billion, accounting for about 29% of the entire cryptocurrency market. This indicates an increasing diversity within the marketplace, with a large share of altcoins.
Several reasons, such as the rise in the number of innovative projects and the development of new use cases for blockchain technology, are behind this growth. The growing popularity of decentralized finance (DeFi) platforms and non-fungible tokens (NFTs) has resulted in an increasing interest in the use of altcoins. As interoperability in the blockchain space and cross-chain solutions become more widely used, the altcoin space is likely to continue to grow, providing more opportunities for a broader range of investments.
Gainers vs. Losers: 84% Gain, 16% Loss
The Gainers vs. Losers chart shows that 84% of cryptocurrencies are currently trading at a profit, with 16% reporting losses. This indicates that despite the general caution in market sentiment, a large part of the market is receiving positive returns.
The high percentage of gains in cryptocurrencies reflects positive market performance, especially the established cryptocurrencies, such as Bitcoin and Ethereum. The market remains bullish, primarily due to the performance of many cryptocurrencies in times of increased volatility.
Outlook for Q4 2025
Looking ahead, U.S. Senate committees are reviewing crypto market structure legislation after bipartisan support in the House. The SEC’s approval of generic listing standards for exchange-traded products may further expand investor access. Monetary policy also plays a role. The Federal Reserve’s September rate cut, with the potential for additional reductions, could support investor appetite for digital assets. Risks remain from labour market weakness, equity market valuations, and geopolitical pressures.