
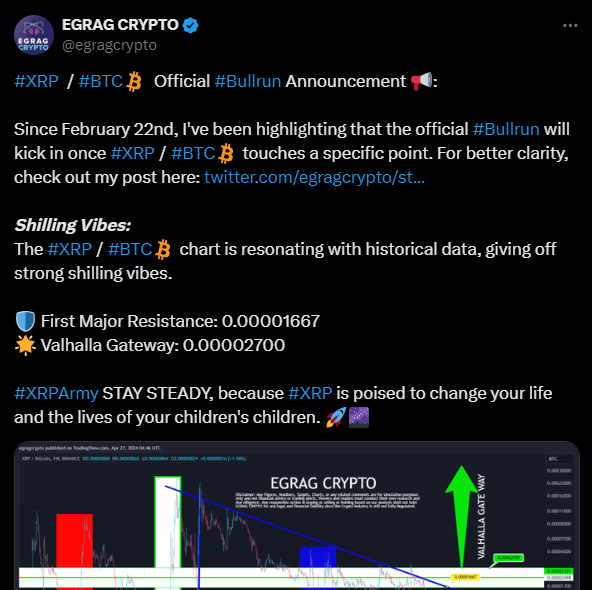
The cryptocurrency market is enthusiastic as traders and enthusiasts eagerly await the much-anticipated bull run for XRP against Bitcoin (#XRP / #BTC). As highlighted by Egrag Crypto, a top analyst, since February 22, speculation has been rife regarding a specific trigger point that would mark the official commencement of this bullish surge. Analyzing the XRP/BTC chart alongside historical data, experts have identified key resistance levels and potential gateway points, offering insights into the trajectory of this promising rally.
Recent market data paints a mixed picture for both XRP and Bitcoin. As of the latest figures, XRP is trading at $0.517463, experiencing a slight decline of 2.65% over the past 24 hours. Meanwhile, Bitcoin stands at $62,928.48, registering a similar 2.48% decrease within the same timeframe. These fluctuations underscore the inherent volatility within the cryptocurrency space, indicative of the ongoing tug-of-war between bulls and bears.
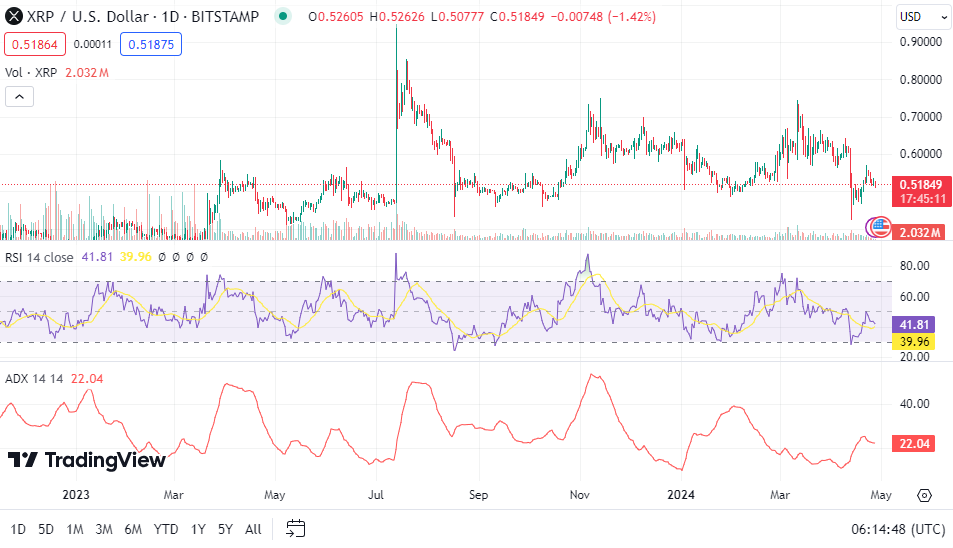
Delving deeper into technical indicators, the XRP-Day RSI stands at 41.58, suggesting a potential approach towards oversold conditions. However, it falls short of triggering a definitive buy signal, leaving room for further market observation.
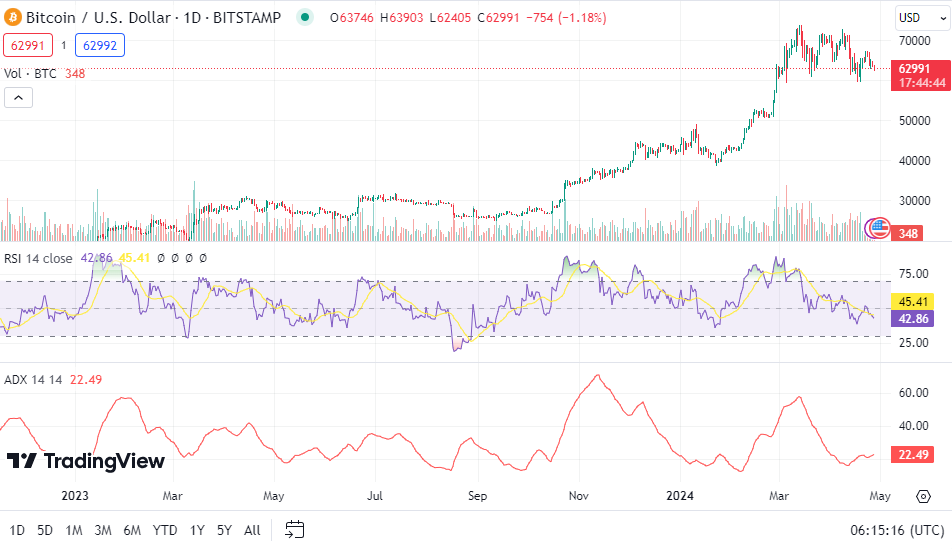
On the other hand, Bitcoin’s 1-Day RSI hovers at 42.65, hinting at a similar possibility of nearing oversold territory. Regarding momentum, the 1-Day MACD for both XRP and Bitcoin provides additional insight.
While XRP’s MACD exhibits a slight upward trend above the signal line, indicative of nascent bullish momentum, Bitcoin’s MACD depicts a contrasting picture. With Bitcoin’s MACD trading below the signal line, a bearish sentiment pervades, signaling potential selling pressure in the short term.
Moreover, the 1-Day ADX readings for XRP and Bitcoin offer valuable context regarding trend strength and market direction. With XRP’s ADX at 22.04, a discernible trend emerges, albeit without significant conviction. Similarly, Bitcoin’s ADX reading of 22.49 reflects a lack of a pronounced trend, suggesting a period of consolidation before a decisive move unfolds.