XRP enthusiasts are abuzz with anticipation as the cryptocurrency approaches critical price points. With unwavering confidence, Egrag Crypto, a top analyst, believes that XRP will break out of its current pattern and hit the $1.5 mark soon. This expectation is grounded in technical analysis, particularly focusing on the White Triangle formation and the subsequent measured move.
Furthermore, the Fibonacci retracement zone between $6.5 and $7.5 is pivotal. Investors are eyeing this range for potential profit-taking. Closing above this Fib 1.618 zone on a weekly basis could propel XRP to even higher targets, reaching the mid-double digits near the Fib 2.414 and 2.618 levels.
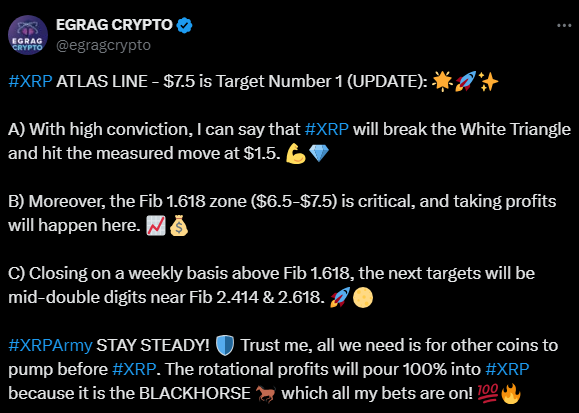
The XRP community, often referred to as the XRPArmy, is urged to remain steadfast. The theory is that as other cryptocurrencies experience gains, rotational profits will eventually flow into XRP, given its potential as a “black horse” in the market. This perspective is bolstered by a broader market sentiment that XRP could see significant gains once other coins have had their run.
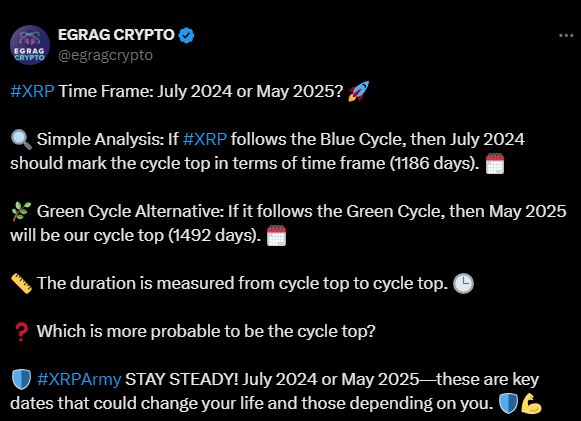
Looking at time frames, two primary scenarios are under consideration. As further noted by Egrag Crypto, if XRP follows the Blue Cycle, the anticipated cycle top could be around July 2024, marking 1186 days from the previous cycle top.
XRP Sees Massive Buy Volume as Price Approaches Critical Support ZoneAlternatively, if it follows the Green Cycle, the cycle top might occur around May 2025, which would be 1492 days from the last peak. These projections are based on historical patterns and cycle duration measurements.
Currently, XRP is trading at approximately $0.498257, with a 24-hour trading volume of $892,091,664. The cryptocurrency has seen a modest increase of 0.67% over the past 24 hours. Technical indicators provide mixed signals but generally point towards potential bullish developments. The 1-day Relative Strength Index (RSI) at 39.00 suggests that XRP is nearing oversold conditions.
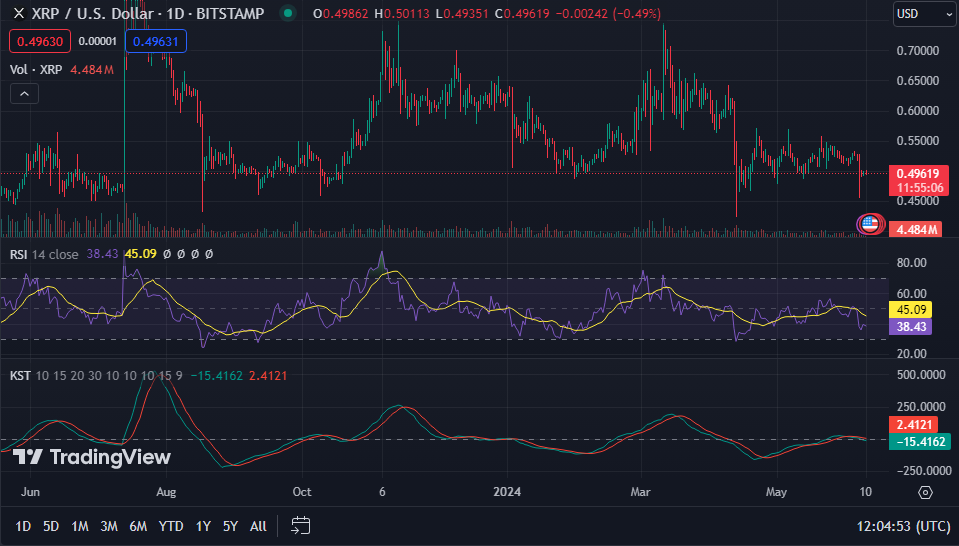
Moreover, the Moving Average Convergence Divergence (MACD) indicator, although trading below the signal line, hints at a possible reversal as buying pressure builds. The Know Sure Thing (KST) indicator, currently at the zero line, also suggests that XRP might be reaching a point of equilibrium, signaling a potential trend reversal in the near future.