
A bullish or bearish breakout await inside flag technical chart pattern in Aptos
Aptos price remains neutral with mild bullish movement. The price continues to trade in a very close trading range since March 24. Crypto Analyst Ali plotted an interesting price pattern on the daily technical chart.
As of press time, APT/USD is exchanging hands at $11.67, up 1.04% for the day. According to Coinmarketcap, the 24 hour trading volume rose 29.48% to $203,837,955. In general, a rise in price with a rise in volume is a bullish sign.
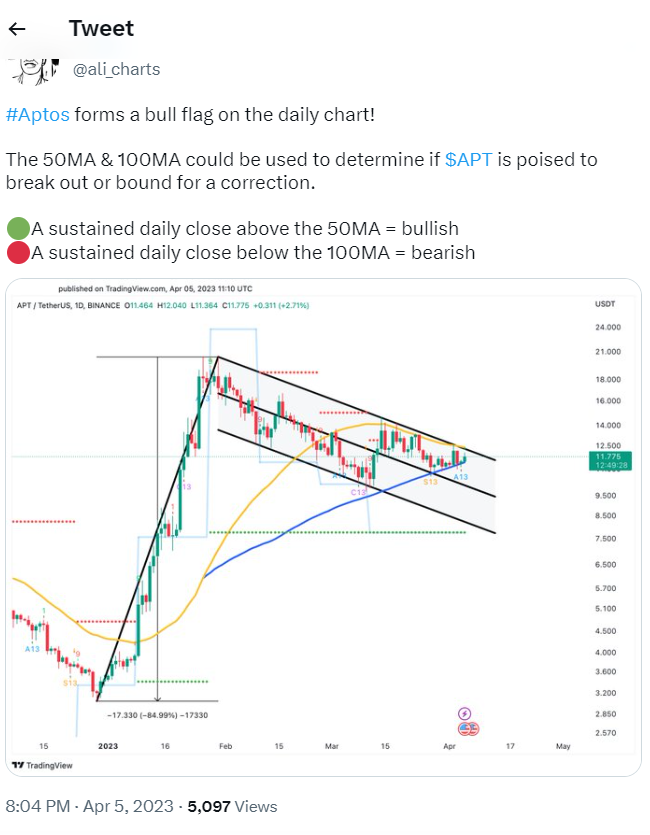
Analyst, found an interesting technical price pattern, a bullish Flag pattern. The bullish flag chart formed with a pole and a downward-sloping channel with two parallel trend lines that run against the prevailing trend.

With the above formation, the Aptos price is consolidating for the past few sessions and might be preparing for an upside movement. As the daily RSI (14) indicates a bullish divergence. Further, the two critical moving averages namely, the 50-day Moving Average (MA) and 100-day Moving Average (MA) movement could be a determinant for the next price action.
As per the Analyst,” the 50-day MA and 100-day MA would decide if the APT price will give a bullish or bearish breakout. According to analysis, a sustained daily close above the 50-day MA would be a bullish sign.
On the other hand, a sustained daily close below the 100-day MA could be a bearish sign.
After making the high of $20.30 on January 26, the APT price continues to decline, finding a support zone near $11.50.


