
As Ki Young Ju, the Founder and CEO of CryptoQuant, recently highlighted on X, Bitcoin is currently in a distribution phase, not yet fully distributed to retailers. This insight sheds light on the cryptocurrency’s current market position. At present, Bitcoin is trading at $41,620.16, marking a modest increase of 1.07% over the last 24 hours.
Despite this incremental rise, its market cap is robust, floating around $815.89 billion, with a significant 24-hour trading volume of approximately $36.65 billion. The total supply of Bitcoin is capped at 21 million coins, which is pivotal in understanding its market dynamics.
This cap suggests that the distribution process is still ongoing, setting the stage for potential short-term market corrections. However, it also indicates the possibility of a prolonged bull market until the distribution reaches its peak.

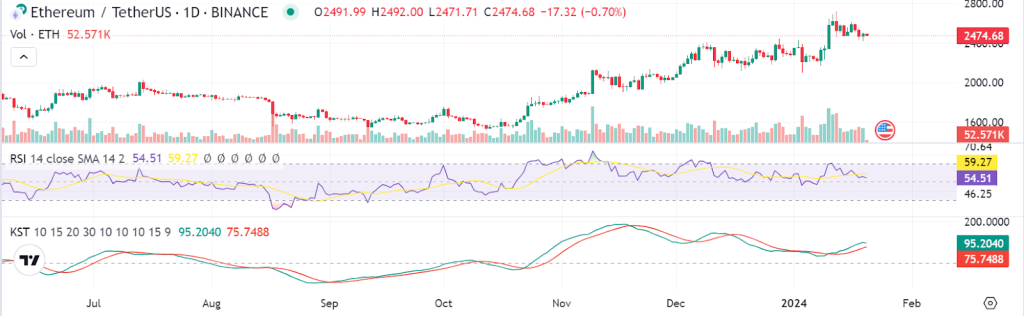
The current Relative Strength Index (RSI) for Bitcoin stands at 43.27, placing it in a neutral zone. This signals a balanced market sentiment, potentially leading to a period of price stabilization or sideways movement in the near term. In contrast, the 4-hour Moving Average Convergence Divergence (MACD) presents a starkly different scenario, indicating strong bearish momentum. This suggests the likelihood of a near-term downward price correction.
On the other hand, the 4-hour Know Sure Thing (KST) indicator offers an optimistic outlook, pointing to strong positive momentum for Bitcoin. This could lead to an upward trajectory in prices or support the continuation of the current bullish trend. This divergence in technical indicators is a testament to the complex and volatile nature of the cryptocurrency market.
Therefore, it is essential for investors and market participants to tread carefully amidst these mixed signals. The contrasting indications from the MACD and KST emphasize the importance of a nuanced understanding of the market trends. Importantly, the current market phase is marked by a combination of bullish long-term prospects and bearish short-term signals, necessitating strategic and informed decision-making from investors.
While the Bitcoin market offers growth opportunities, it also demands meticulous analysis and prudent risk management. The current neutral RSI, along with the conflicting signals from MACD and KST, points to a market in a state of flux. Investors are advised to remain well-informed and adopt a balanced approach in their investment strategies, weighing both potential risks and rewards in this evolving digital currency landscape.