The crypto market, as per ICO Drops, maintains a neutral stance, reflecting both caution and opportunity.
Bitcoin's persistent trading at $42.8K serves as a focal point, signifying a crucial battleground for market forces.
DeFi volumes at $4.92B showcase resilience, while stablecoins dominate at $50.39B, revealing a cautious market sentiment.
- The crypto market, as per ICO Drops, maintains a neutral stance, reflecting both caution and opportunity.
- Bitcoin’s persistent trading at $42.8K serves as a focal point, signifying a crucial battleground for market forces.
- DeFi volumes at $4.92B showcase resilience, while stablecoins dominate at $50.39B, revealing a cautious market sentiment.
In the dynamic realm of cryptocurrency, the most recent market overview revealed a neutral stance, with the overall market cap stabilizing at around $1.70 trillion. Bitcoin, a stalwart in the crypto space, maintains its steadfast position, trading at $42.8K. Over the last 24 hours, the crypto market experienced a 5.59% decrease in total volume, settling at $54.79 billion.
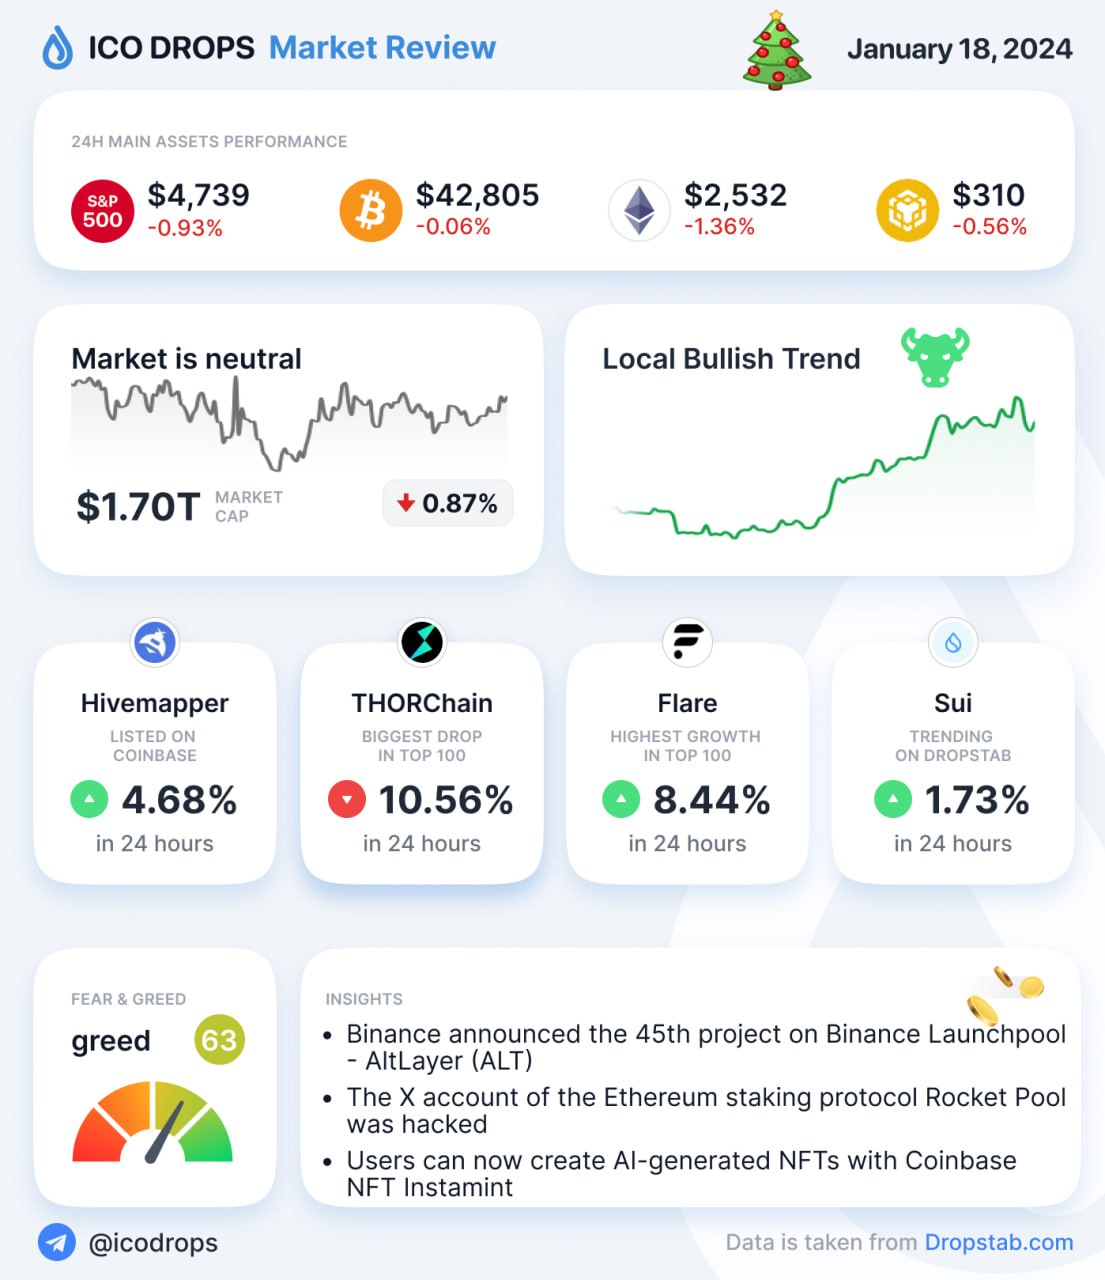
Digging deeper, the decentralized finance (DeFi) sector contributes $4.92 billion to the overall volume, representing 8.98% of the total crypto market 24-hour volume. Notably, stable coins continue to play a significant role, constituting $50.39 billion or 91.97% of the total crypto market 24-hour volume. These figures highlight a market characterized by diversity and a reliance on stable assets.
In a recent tweet, ICO Drops, renowned for insightful crypto market analysis, unveiled a neutral market landscape with a $1.70T cap and Bitcoin at $42.8K:
Bitcoin, with a dominance of 49.23%, weathered recent market fluctuations with resilience. Despite a modest 0.19% increase, trading at $42,809.99, Bitcoin’s performance demonstrates stability. The historical chart reveals a consistent trajectory, showcasing its ability to serve as a store of value. Interestingly, the Fear/Greed Index, a sentiment indicator, signals a market leaning towards greed, standing at 63. This sentiment, coupled with a 2.81% decrease in BTC dominance on January 12, suggests a potential shift in investor sentiment and allocation.
Technical analysis unveils patterns indicative of Bitcoin’s robust position. The 7-day chart illustrates a slight decline, echoing the overall market sentiment. However, the 1-month chart reflects a resilient standing, with a 65 on the Fear/Greed Index and a 6.94% decrease in value. Investors keen on long-term strategies might find Bitcoin’s stability and historical performance an encouraging sign.
Ethereum, the pioneer of smart contract platforms, stands at $2,532.11, witnessing a drop of 1.12% in the past 24 hours and a 1.96% decrease in the last month. Ethereum’s market cap, at $303.77 billion, reflects its pivotal role in the crypto space.
A historical chart of Ethereum shows a dynamic pattern, mirroring the market’s inherent volatility. The 7-day chart reveals a minor decline, signaling the broader market trends. However, the 3-month chart portrays a more comprehensive perspective, indicating a gradual decrease in value.
Navigating through the intricate crypto landscape requires acknowledging the broader financial context. The S&P 500, a benchmark for traditional markets, stands at $4,739.66 with a -0.93% change. This divergence between traditional and crypto markets underscores the dynamic nature of these assets and the evolving investment landscape.
In conclusion, the current state of the crypto market is one of cautious optimism. Bitcoin, as a beacon of stability, continues to shape the narrative, while Ethereum grapples with short-term fluctuations. The interplay of technical indicators and market sentiment provides a nuanced understanding, guiding investors through the waves of volatility. As the crypto saga unfolds, strategic decision-making remains paramount in navigating this ever-evolving financial frontier.