

- Bitcoin’s potential surge to $60K upon breaking resistance excites enthusiasts, highlighting market anticipation and optimism.
- Glassnode’s analysis underscores the significance of Bitcoin’s current juncture, with only 2.52% of past days recording higher prices.
- Despite bullish indicators like RSI and MACD, traders exercise caution amidst potential resistance, emphasizing prudent risk management.
Amidst the fervent anticipation among Bitcoin enthusiasts, there’s a notable buzz surrounding the cryptocurrency’s journey toward a crucial resistance level. CryptoBusy, an analytic platform, succinctly captured this sentiment with its tweet suggesting an imminent surge to $60K upon Bitcoin breaking through this significant barrier.
Bitcoin’s price lingers around $51,855.26, while its 24-hour trading volume surpasses a staggering $44 billion. Such figures underscore the heightened attention among investors, keenly observing potential movements that could redefine the digital asset’s trajectory in the immediate future.
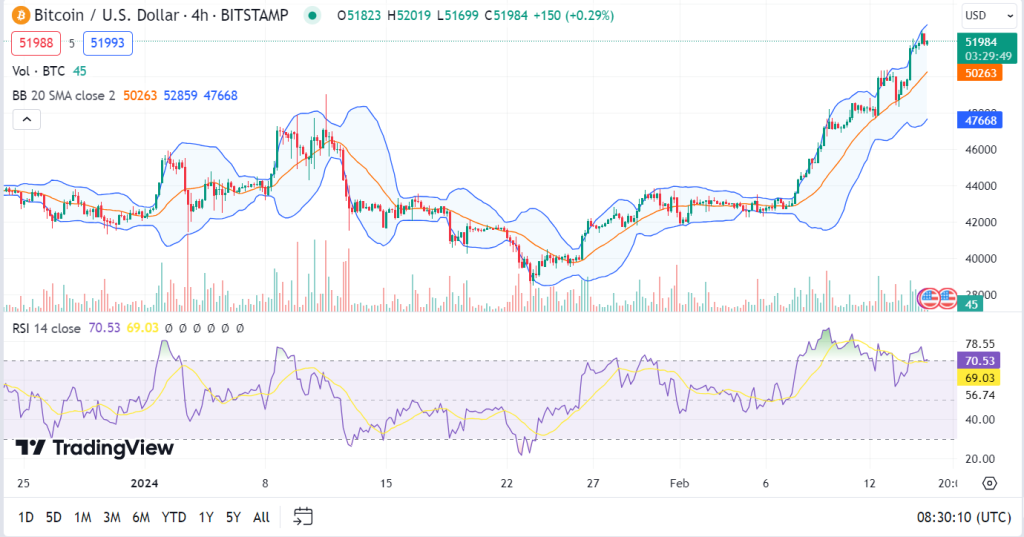
Glassnode’s analytic platform analysis shows that merely 2.52% of the past 125 trading days have witnessed a higher daily closing price. This statistic emphasizes the pivotal nature of the current market juncture as Bitcoin inches closer to a critical resistance level. Moreover, indicators like the 4-hour Relative Strength Index (RSI) and Bollinger bands offer valuable insights into the asset’s current state and potential future movements.
The 4-hour RSI reading of 70.56 hints at a scenario where Bitcoin might be slightly overbought but has yet to venture into highly overbought territory. This suggests further upward movement before a potential correction occurs. The upper Bollinger band reading of 52860 signals the nearing of a resistance level, which could induce a short-term reversal or consolidation in Bitcoin’s price.
Conversely, the lower Bollinger band reading of 47667 acts as a support level, indicating that Bitcoin’s price trades above its lower boundary, thereby limiting downside risk. This delicate equilibrium between resistance and support levels underscores the relative stability of the asset, albeit against a backdrop of potential volatility.
Further reinforcing the bullish sentiment is the MACD of the 4-hour timeframe, which points to the fact that there’s a continuance of the upward trend of Bitcoin’s price. Nevertheless, the cautious nature of investors cannot be neglected as the intricate dynamics are evident in this market, with a real risk of the shift in sentiments and price actions.
While Bitcoin’s price trajectory appears promising for further gains, significant resistance levels and indicators signal potential overbought conditions. As traders and investors watch the breakout versus a correction phase, deploying effective risk management strategies and a comprehensive understanding of market dynamics is imperative.