Bitcoin Drops as Liquidity Strengthens and Market Structure Shifts

- Bitcoin declines through heavy cost bands as liquidity expands and tension deepens.
- Whale distribution grows while ETF outflows drain demand across critical market levels.
- Options traders shift to defensive positions as treasuries slow and conviction fades.
Bitcoin traded lower through late 2025 even as global liquidity improved, according to new data from Coinbase. The report said that heavy whale distribution, weakening options demand, persistent spot ETF outflows, and slowing treasury activity created a structural breakdown. The firm shared a cost-basis distribution heatmap covering January to November 2025, showing dense supply clusters of over 300,000 BTC between $95,000 and $105,000. The area where long-term holders previously defended the price.
Yet Bitcoin still fell toward $80,000 in November despite the Federal Reserve ending quantitative tightening and returning to the bond market, a shift that historically aligns with Bitcoin upside.
Market Structure Weakens Despite Rising Liquidity
The chart showed repeated retests of the $90,000–$100,000 band early in the year, with cost-basis density increasing to between 250K and 350K BTC as the market sat near breakeven. Price then climbed above $110,000 mid-year, yet supply layers in the cost-basis map thinned only slightly, showing that conviction did not rebuild across key levels.
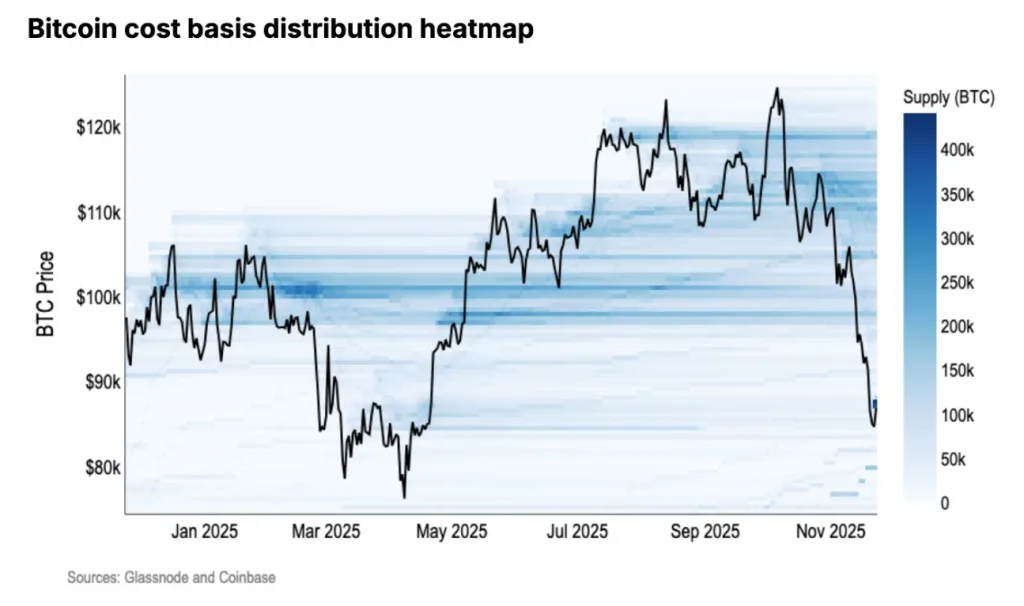
The downtrend that began in October caused Bitcoin to fall cleanly through each historical support range visible in the heatmap. Coinbase reported that these bull-market support bands had already broken before the sell-off accelerated, leaving no strong defense as prices moved lower.
The November portion of the heatmap showed support below $85,000 shrinking to fewer than 25,000 BTC, which marked one of the weakest structural zones on the chart and set the stage for further pressure.
Flows, Derivatives, and Whales Shift Toward Risk Reduction
The report stated that options traders leaned heavily toward downside exposure throughout this period. This matched the fading strength of cost-basis clusters and removed what had been a consistent source of market stability during earlier cycles.
OG whales sold actively during the $105,000–$115,000 period, as shown by deep blue streaks that appeared on the heatmap before fading heading into the final quarter. This selling reduced the pool of long-term holders that often support prices during broader corrections.
Spot Bitcoin ETFs recorded persistent outflows during the same window. Coinbase noted that these outflows cut into institutional demand at a time when liquidity conditions should have supported risk-on flows. Treasury activity, measured through daily active treasuries (DATs), also slowed, signaling reduced transactional use and weaker demand across the network.
Related: Liquidity Strain Rises as Fed Ends QT and Starts Major Policy Shift
A Possible Regime Shift in Bitcoin’s Reaction to Liquidity
According to the studies, Bitcoin’s sensitivity to monetary policy has shifted in recent years, with BTC behaving more like a traditional risk asset since 2020. The asset often fell after tightening cycles and rose when liquidity improved.
Yet this cycle produced a divergence. Liquidity increased, but Bitcoin failed to respond. This pattern last appeared during the 2022 capitulation period, when similar structural issues delayed recovery. Could this mark another regime shift in Bitcoin’s reaction to liquidity?
Analysts noted that the Federal Reserve’s decision to end quantitative tightening by early December usually supports risk assets, yet the market reacted cautiously. A similar pivot in 2019 failed to spark immediate upside, which added further uncertainty to today’s environment.
Data showed that flows moved selectively into utility tokens, alternative chains, and yield-based stablecoins. Bitcoin did not receive the broad re-risking that typically accompanies rising liquidity.