
Bitcoin remains at the forefront of the cryptocurrency conversation as market enthusiasts closely watch its performance. Currently, the digital currency is navigating through a crucial phase, eyeing a significant resurgence towards the $56,000 mark. However, before achieving this milestone, it faces a pivotal moment – a liquidity flush on the downside is anticipated, which could set the stage for the subsequent rally.
Analyst Michaël van de Poppe highlighted the current state of Bitcoin, expecting to see continuation towards the highs, but first, a flush for liquidity on the downside.
Additionally, Ethereum, another major player in the cryptocurrency domain, continues to exhibit strength. Its noteworthy performance signals a healthy market sentiment that could further buoy Bitcoin’s upward journey. The interplay between these two cryptocurrencies is a focal point for investors and traders alike.
According to crypto analyst CryptoTony, Bitcoin must reclaim the $52,000 level within the week to maintain its bullish stance. This figure has become a critical benchmark for bulls, serving as a litmus test for the currency’s short-term trajectory. Achieving this would bolster confidence among investors and solidify Bitcoin’s position for further gains.
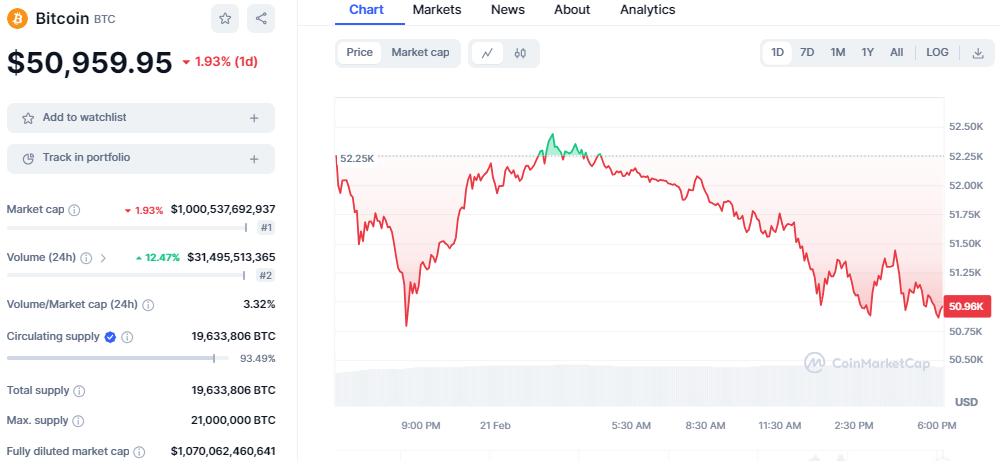
Bitcoin is currently exhibiting a bearish trend as the bearish activity persists. BTC has been trading on a sideways movement over the past week, touching a high of $52,900 and dropping to a weekly low of $50,700. Today, BTC is oscillating between $50,770 and $52,850, with the current price set at $51,229, down by 0.83%.
Technical indicators on the daily chart point to a declining bullish trend. The Relative Strength Index (RSI) has dropped from the overbought region and currently stands at 66.92, suggesting a shift from the bullish momentum as selling pressure increases. The MACD indicator has lost its positive outlook and heads downwards as the MACD line is on the verge of crossing below the signal line.

The analysis of moving averages, including both exponential moving averages (EMAs) and simple moving averages (SMAs), exhibits a bullish outlook. This reflects the market’s solid momentum, especially in the longer-term averages. However, this contrasts sharply with the immediate sell signals that some oscillators are indicating.
While there are indications of a bullish trend, technical indicators also point to overbought conditions that are starting to decline, accompanied by recent patterns of sideways and downward movements. This suggests the possibility of upcoming corrections for BTC. The combination of mixed signals and observed volatility could prompt a more cautious or bearish outlook among investors, who anticipate a period of retraction or consolidation before the continuation of any major bullish trend.


