


- Bitcoin faces resistance near $60,765.13, with potential for a sweep towards $61k if it holds above $55.2k.
- Support zones at $55,202.39 and $50,629.02 are crucial for potential rebounds amid price volatility.
- Technical indicators show Bitcoin’s RSI at 50.54, signaling neutrality, while MACD indicates short-term downward pressure.
Bitcoin’s price action has been captivating traders as it hovers around critical levels. The price of Bitcoin at press time is $58,385, reflecting a 1.39% increase in the last 24 hours. The trading volume stands at $28,801,052,445. As Bitcoin attempts to hold above key support levels, traders are analyzing potential scenarios.
Bitcoin recently dipped below the crucial support level of $55,202.39 but has rebounded slightly, now testing this level as resistance. The price rejection at the $60,765.13 resistance level indicates significant selling pressure.
Despite this, there is a potential for a short-term upward movement, with the price aiming to retest the $60,765.13 level. According to VeLLa Crypto, an analyst, if Bitcoin can hold above $55.2k on the daily timeframe, a sweep of the previous range lows between $60.7k and $61k might occur. This range could act as a resistance area.
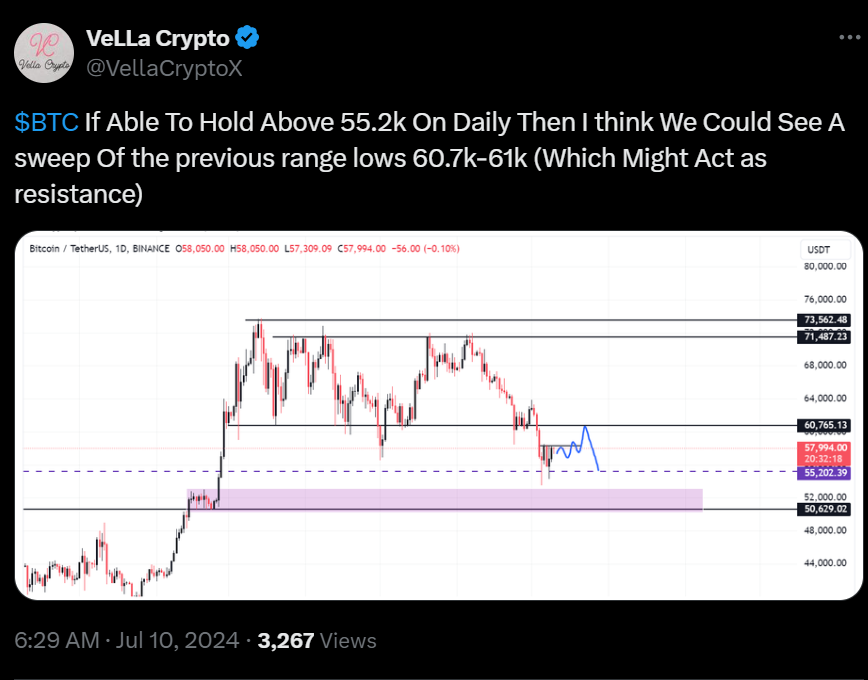
Analyzing the price action further, the area around $55,202.39, previously a support level, now acts as a new resistance. This zone, alongside the significant support range between $50,629.02 and $55,202.39, could provide a strong base for a potential bounce if the price falls further. The purple-highlighted area on the chart emphasizes this crucial support zone.

Considering potential scenarios, the bullish outlook suggests that if Bitcoin can break and hold above $60,765.13, it may target the next resistance levels at $71,487.23 and $73,562.48. A successful breakout above these levels could indicate a stronger upward trend.
Bitcoin Sentiment Hits One-Year Low, Indicating Potential ReboundConversely, the bearish scenario posits that if the price fails to reclaim the $60,765.13 level and falls below $55,202.39 again, it may test the lower support around $50,629.02. A breakdown below $50,629.02 could lead to further declines, potentially testing lower levels not visible on the chart.

The 1-week Relative Strength Index (RSI) reads 50.54, indicating that Bitcoin is currently in a neutral state, neither overbought nor oversold. However, the 1-week Moving Average Convergence Divergence (MACD) trading below the signal line suggests downward pressure on Bitcoin’s price in the short term.


