Bitcoin Falls Toward Key Levels as Liquidations Strike Hard

- Bitcoin touches a major zone as a clear downtrend forms through multiple levels.
- Liquidations rise fast as traders close high-risk positions during sharp market motion.
- Stablecoin inflows jump strongly as the market loads a fresh power for the next wave.
“Bitcoin retests the $95,195 support level after sliding within a descending trend channel, reflecting sustained pressure as the market trades near recent lows. The chart reveals repeated rejections from higher resistance zones and ongoing lower-high formation, indicating the risk of extended losses if buyers fail at this level.
BTC rejected the wide R2 zone between $118,000 and $125,958, aligning with the 1.414 Fibonacci extension at $125,958.47, before dropping sharply. It then moved back into the R1 region below $116,262, where selling pressure increased and initiated the early phase of the current decline.
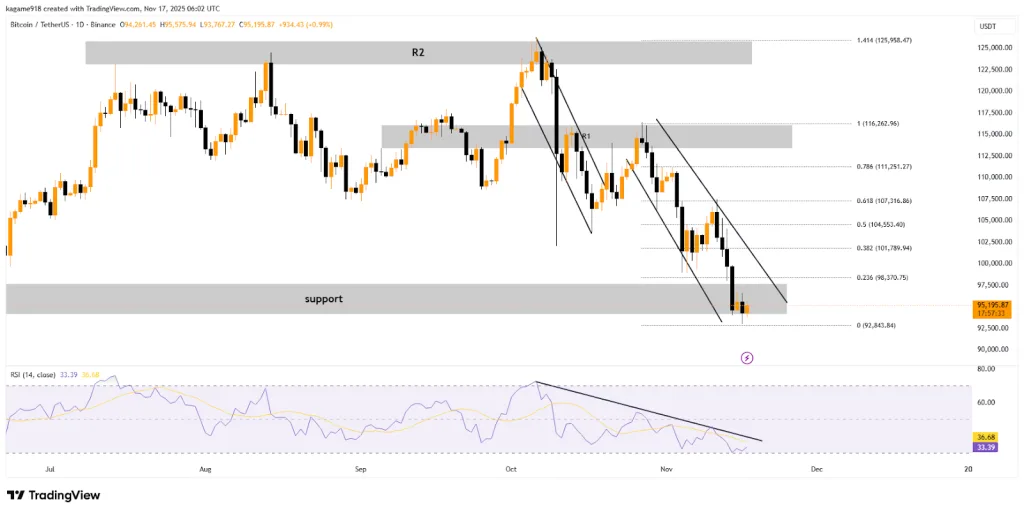
The market trades below the 0.236 Fibonacci level at $98,370.75, which has rejected multiple close attempts. Price interacts directly with the wide support band around $95,000, forming the current technical pivot. If this level fails, BTC likely approaches the 0.0 Fibonacci target at $92,843.84, based on chart structure.
The RSI value of 33.39 follows a declining path from the October peak of around 78. This development indicates dwindling strength across the chart, and it also reflects the common lower-high price movement pattern.
In order to recover, Bitcoin needs to rise above the upper line of the descending channel, close to $100,000. Resistance would then be at $101,789, $104,553, and $107,316, which are progressive Fibonacci levels that usually create structured barriers.
Market Liquidations Rise Sharply as Traders Face Heavy Losses
The market experienced a total of $619.75 million in liquidations over the last 24 hours, a sign of increased volatility among different tokens. The major contributors to this combined total were BTC with $243.53 million and ETH with $169.99 million. Together, they accounted for the biggest part. The market liquidations of SOL were $21.70 million, ZEC was $31.98 million, and other assets contributed $36.20 million.
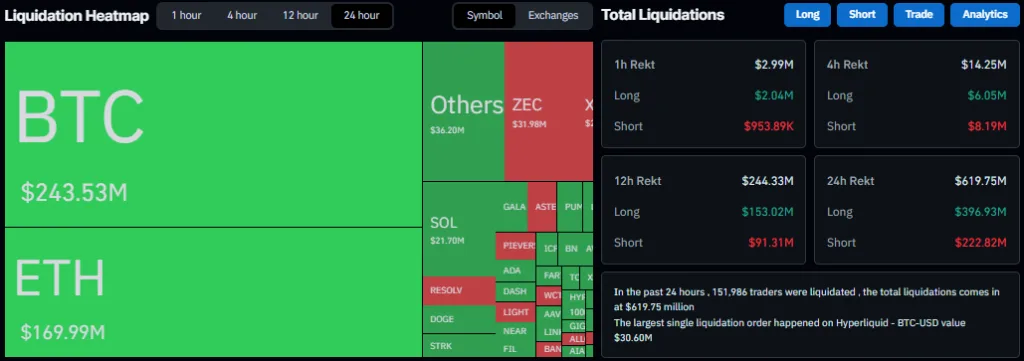
Liquidation activity remained high even in shorter time frames. One-hour data shows the figure of $2.99 million, among which $2.04 million came from long positions, while $953.89k was from shorts. Four-hour figures reached $14.25 million, with $6.05 million in long liquidations and $8.19 million in shorts being the driving forces. Twelve-hour was keeping track of $244.33 million, with longs representing $153.02 million and shorts $91.31 million.
A total of 151,986 traders were liquidated during the 24-hour period. The largest individual liquidation was $30.60 million on Hyperliquid’s BTC-USD pair, which became the heaviest single loss in the timeframe. These figures reflect elevated market stress during the decline.
Related: Bitcoin Sinks to Five-Month Low as Losses Rise Rapidly
Stablecoin Reserves Show Strongest 30-Day Surge Since 2024
Exchanges recorded a +$7.3 billion rise in ERC-20 stablecoin reserves over 30 days, marking the strongest increase since the November 2024 BTC rally, according to CryptoQuant data. Reserves climbed across Binance, Bybit, OKX, and other platforms, forming a vertical break from the previous oscillating structure.
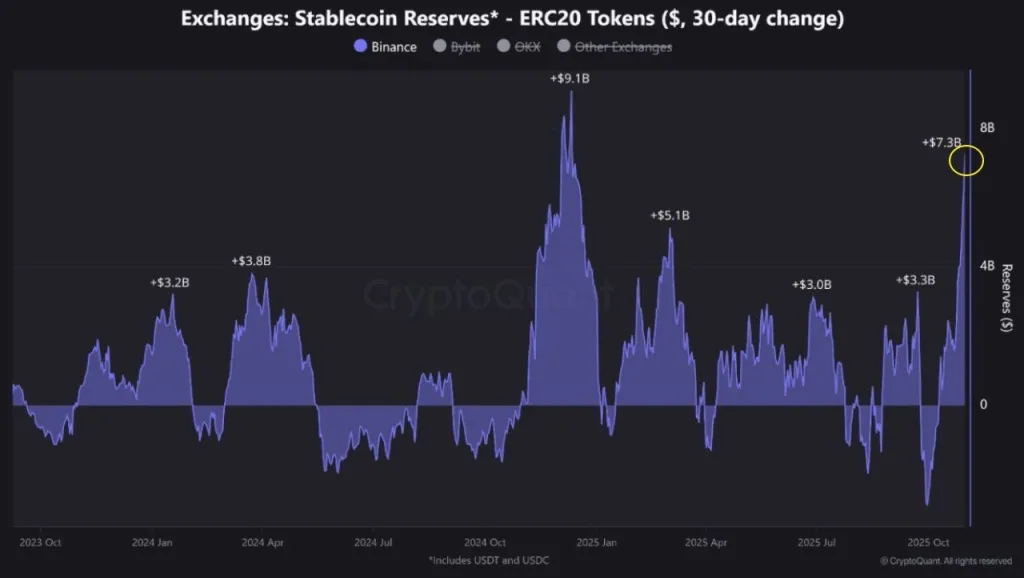
Earlier peaks include +$3.2B in early 2024, +$3.8B in April 2024, +$9.1B in late 2024, +$5.1B in early 2025, +$3.0B in mid-2025, and +$3.3B in late 2025. These values show a pattern of periodic expansions that preceded notable market reactions. The strongest rise occurred during late 2024 when the +$9.1B jump appeared shortly before a multi-week BTC breakout.
This latest +$7.3B surge appears as a sharp deviation from the long oscillating pattern between 2023 October and 2025 October, where reserves frequently crossed above and below zero. Reserves increasing at this scale often indicate exchange readiness for higher trading activity, based on historical readings.