
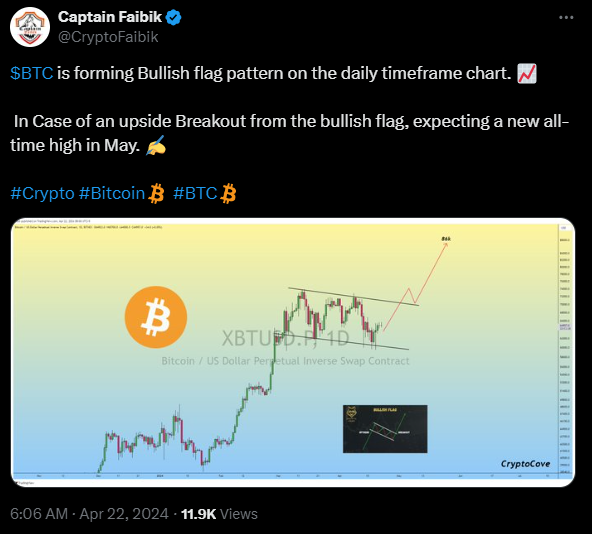
Bitcoin is showing promising signs of a bullish breakout, with technical indicators hinting at a potential surge towards new all-time highs in the coming months. According to analyst Captain Faibik, the daily timeframe chart reveals the formation of a bullish flag pattern, a classic signal of upward momentum in the crypto market.
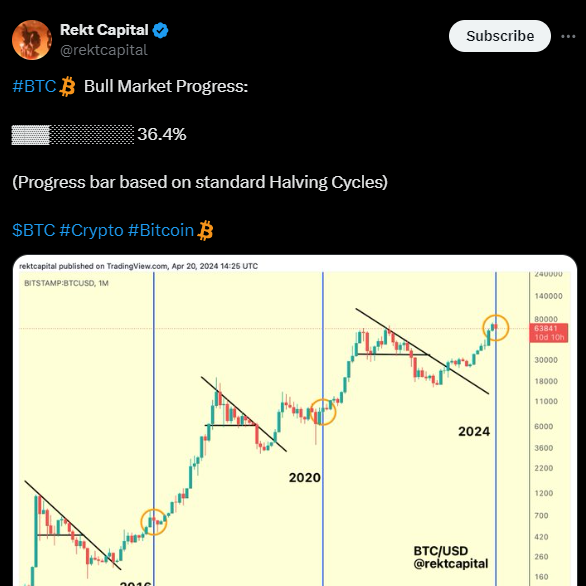
As highlighted by Rekt Capital, a top analyst, the current progress, as depicted by a halving cycle-based bar, suggests that the market is at around 36.4% of the expected bull market trajectory. Interestingly, this cycle combines elements from the strong demand of 2013 and the dominance of spot trading seen in 2017.
Bitcoin’s supply in profit has reached 88.8%, down from earlier high. Notably, the correlation between Bitcoin and the Global Liquidity Index has broken in 2024, stressing the need for a liquidity boost to sustain the ongoing bull run, particularly in anticipation of the US elections.
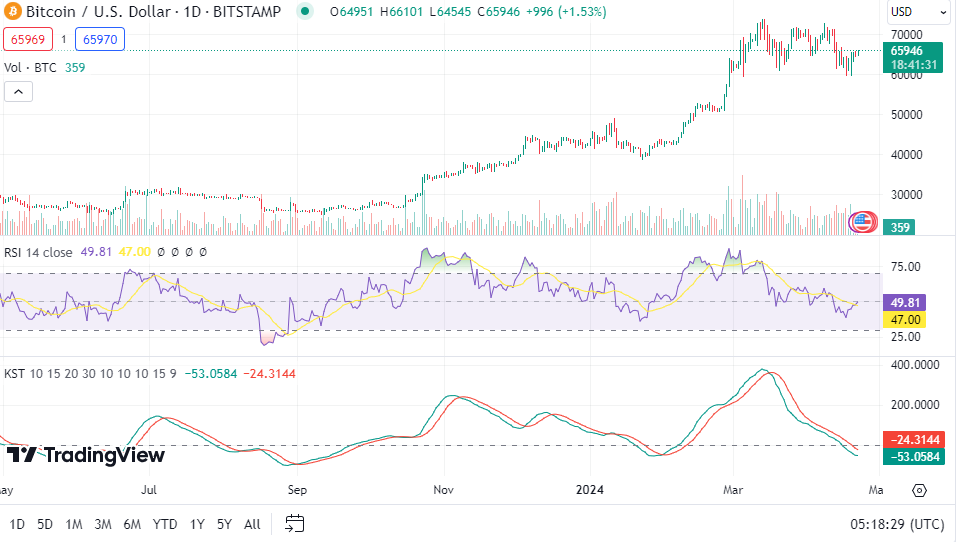
The current price of Bitcoin stands at $65,833.85, having experienced a modest 24-hour increase of 1.04%. However, the technical indicators paint a mixed picture. The 1-day RSI reads 49.63, suggesting a neutral market sentiment with potential for movement in either direction. On the other hand, the 1-day MACD and KST both indicate a short-term bearish trend, signaling caution in the immediate future.
Crypto analyst Ali Martinez points out an intriguing pattern related to the Bitcoin MVRV ratio, indicating potential buying opportunities when the ratio dips below its 90-day average. Historical data suggests that such moments have yielded an average gain of 67%, presenting an enticing scenario for Bitcoin investors.
Key price levels serve as critical indicators for Bitcoin’s next moves. If Bitcoin climbs to $75,000, it could signal a bullish confirmation and mark a bottom. Conversely, a drop below $58,000 would suggest further downside risks.