Bitcoin Near 100K as Past Cycle Signals Fresh Downside Risk

- Bitcoin trades below the 200-day average as a familiar breakdown pattern forms again.
- Options hedging climbs near 100K as traders prepare for sharper price swings soon.
- Analysts see history repeating itself if a push toward 100K loses strength quickly again.
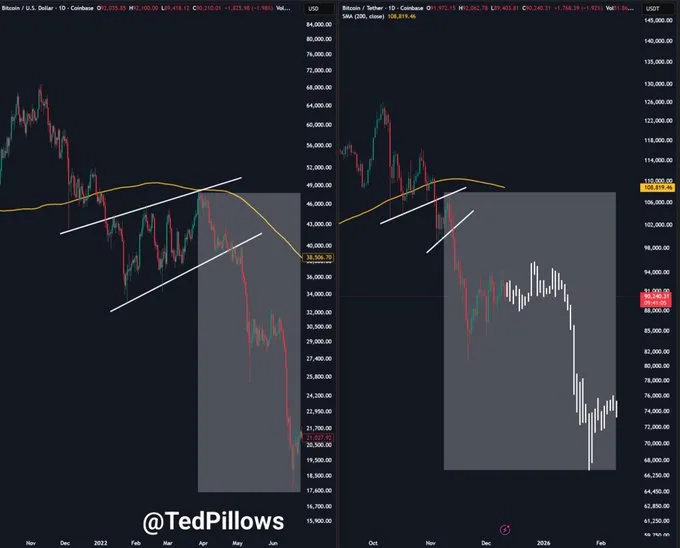
Bitcoin is showing strong similarities to its previous market cycle as price action, options data, and trader commentary converge around key technical levels. Charts shared by analyst Ted Pillows on X compare Bitcoin/USD from 2021 to 2022 with Bitcoin/USDT from 2024 to 2026 and show nearly identical behavior around the 200-day simple moving average.
In both cycles, Bitcoin traded below the SMA 200, previously near $38,500 and currently around $108,819, before breaking down from rising channels. At the same time, Glassnode data shows options traders increasing downside protection as Bitcoin trades between $80,000 and $100,000.
Cycle Structure Reflects Prior Breakdown Pattern
The earlier cycle shows Bitcoin failing near the 200-day SMA around $46,000 after forming a rising wedge between $30,000 and $48,000. Once the price broke the lower trendline, Bitcoin fell from about $42,000 to nearly $21,000. That move represented a drawdown close to 50% within weeks.
Source: X
Trading volume increased during that decline. The expansion supported distribution rather than accumulation during the breakdown phase. Price action confirmed that sellers controlled the market once the channel failed.
In the current cycle, Bitcoin rejected the 200-day SMA near $108,800 after trading inside a rising channel between $92,000 and $104,000. The price then dropped sharply from $102,000 to the $74,000–$70,000 range. Long bearish candles reflected strong selling pressure.
Options Market Shows Rising Demand for Protection
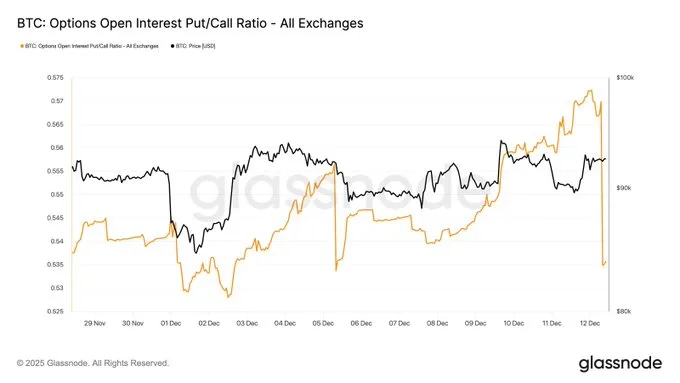
Glassnode data posted on X tracks the BTC Options Open Interest Put/Call Ratio across all exchanges from November 29 to December 12. During that period, the ratio ranged between roughly 0.525 and 0.575 while Bitcoin traded mostly between $90,000 and $98,000. The data suggest active hedging rather than calm directional positioning.
Source: X
From Nov. 29 to Dec. 1, the ratio stayed near 0.54 as Bitcoin slipped from about $92,000 toward $90,000. That behavior showed balanced positioning with limited downside insurance. On Dec. 2, the ratio dipped toward 0.53 as the price rebounded above $93,000.
Between Dec. 3 and Dec. 5, the ratio climbed toward 0.555 while Bitcoin stalled near $95,000. The rise pointed to growing defensive bets. On Dec. 5, the ratio reset near 0.535 as the price stabilized.
Analysts Flag Further Downside Risks Despite Mixed Signals
From Dec. 9 to Dec. 11, the put/call ratio surged above 0.57 as Bitcoin tested the $98,000–$100,000 range. The move implied aggressive downside hedging near local highs. By Dec. 12, the ratio dropped sharply, suggesting position roll-offs rather than renewed optimism.
Related: Saylor Renews Bitcoin Banking Vision as Strategy Buys More BTC
Ted Pillows described the cycle resemblance as “truly shocking” on X. He stated Bitcoin could still rally toward $100,000 before reversing again. Based on the prior cycle, such a rally could fail to hold above the 200-day SMA and target levels under $70,000.
After a pullback to $80,000, Bitcoin stalled within an ascending channel that could form a bear flag. Trader Roman said Bitcoin could fall to $76,000. “Time to fall to $76,000,” he wrote on X, citing price action, volume, RSI, and MACD.
Roman added that macro factors and equities no longer drive crypto prices. He stated that Bitcoin has risen by 750% from the $15,600 low in 2022 and warned of a future drop toward $50,000. Still, CryptoQuant contributor CryptoOnchain reported record Binance outflows and multi-year lows in deposits, indicating that long-term holders maintain confidence.
With cycle fractals, options hedging, and trader forecasts aligning, the market faces one straightforward question: can Bitcoin defy its own history near $100,000?