Bitcoin Nears $116K as Futures Open Interest Soars to $100B
- Bitcoin trades at $115,938 with resistance at $116,263, signaling heavy buyer activity
- Open interest nears $100B, showing a surge in leveraged positions and trading conviction.
- Analyst Cowen warns the cycle may top soon if Bitcoin fails to hold above its support.
Bitcoin (BTC) continued its upward drive on October 27, trading at $115,938 after gaining 1.20% in 24 hours, according to Tradingview data at press time. The cryptocurrency has rebounded sharply from $103,528 earlier this month, forming a rising channel that reflects renewed market optimism. Yet, the advance now meets a key resistance level around $116,263, where previous rallies have typically faced rejection.
The action comes as part of the overall increase in market activity, where the amount of futures contracts that are open to trading went to almost $100 billion, according to Coinglass. The increase in futures contracts is the same as Bitcoin’s spot price moves within the range of $100K and $120K, indicating that there are a lot of traders with leverage who are taking very active positions. Higher prices and greater open interest are together giving a signal that a battle between bulls and bears is going on, and it is a matter of the volatility that is developing.
Bullish Structure Builds, but Resistance Tightens
Chart data indicates that Bitcoin has recovered several Fibonacci retracement levels after an October correction. The 0.618 level, at approximately $113,541, has become short-term support, and the 0.786 level, at around $116,263, is immediate resistance. A prolonged breakout past this area could take prices up to $119,730, which is the next Fibonacci extension. After that, the final bullish target is at $126,000.
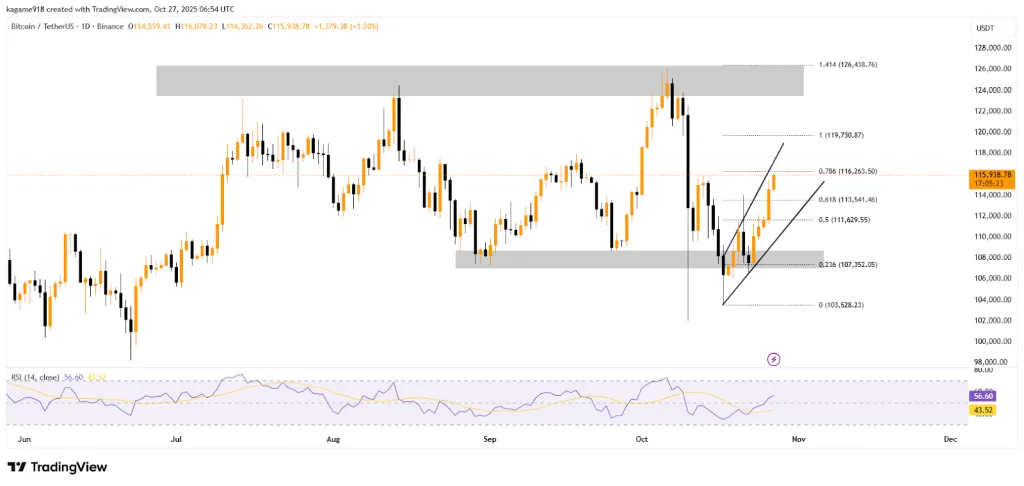
Source: TradingView
However, lower support is in the $107,352 to $108,000 area. If the market declines and prices fall below the 0.5 retracement level at $111,629, Bitcoin may return to these lower support levels before resuming its upward trend. The Relative Strength Index (RSI) is at 56.6, indicating that the market is somewhat bullish but not overly so, as there is no overbought signal. Traders read this as a safe area with minimal volatility, thus leaving room for more players to enter before the market turns against the bulls.
Analyst Sees Cycle Tension Ahead
Analyst Benjamin Cowen commented on his YouTube channel about Bitcoin’s late-cycle behavior, suggesting the clock may be ticking on the current bull phase. “We had a pretty good week,” he said. “Bitcoin closed back above the bull market support band. At this stage in the cycle, there’s not much time left to fall below it.”
Cowen noted that if the four-year cycle pattern holds, Bitcoin may seek a top during the fourth quarter of this year. He added that historical patterns show quick “fake-outs,” where Bitcoin briefly dips below the support band before regaining momentum. Cowen referred to the 2019 market as an example of behavior like this, adding that such quick reversals might characterize the market’s final stage before it dies off.
His comments align with the technical indicators, which suggest short-term strength but mid-term weakness at the same time. The rapid recoveries and quick fake-outs are reminiscent of the previous market tops, which means that this phase could be decisive for the long-term direction of the market.
Related: $300 Solo Miner Hits $347K Bitcoin Block Jackpot
Futures Market Builds Pressure
According to Coinglass data, the open interest has increased gradually from below $20 billion at the beginning of 2024 to more than $80 billion by the middle of the year, reaching almost $100 billion in September. During the same period, Bitcoin’s spot price increased from $40,000 to $120,000, representing a 200% rise. Generally, this type of situation, characterized by open interest and price alignment, is indicative of impending volatility, as the market’s risk of liquidation affects leveraged positions.
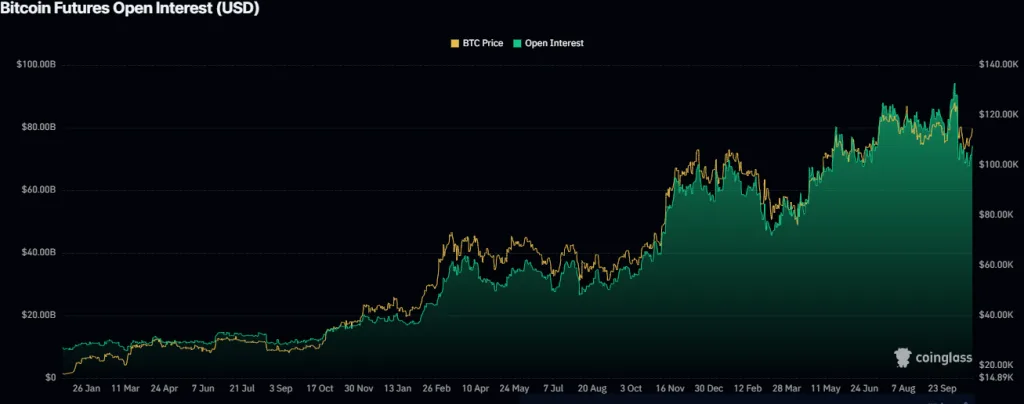
Source: Coinglass
At the end of October, the open interest continued to show records at a high level in history. The pattern indicates that traders are still taking huge leveraged risks, even after the multiple liquidation events that occurred in the earlier part of the year. Analysts view this dynamic as a setup for another sharp move—potentially toward $140,000 or a corrective dip to $90,000.
Rising leverage often fuels dramatic outcomes, leaving one side of the trade on the wrong end of volatility. In a market where conviction meets margin, the data serves as a reminder that even in crypto, gravity eventually returns.