Bitcoin Nears $87K as Holder Demand Climbs to Record Heights
- BTC moves inside a clear down channel that forms lower highs through each decline.
- BTC permanent holder demand hits record high above 100K, showing strong long-term accumulation.
- Supply ratios fall to rare loss zones that once marked major cycle turning points.
Bitcoin extended its decline on Monday as the price slid to $90,075, moving closer to the $87,500 zone in a persistent downward channel that began after a rejection near $126,000. The market structure shifted as the asset failed to reclaim R1 at $115,000 and R2 near $125,000, while sellers have dominated since early October.
Despite Bitcoin dipping below $90K, the sharp rise in permanent holder demand signals that long-term capital continues accumulating aggressively, even as short-term sentiment weakens. This creates a rare setup where heavy selloff pressure meets record conviction, suggesting that underlying demand may offer a stabilizing force if market conditions begin to shift.
Down-Channel Pressures Bitcoin
Bitcoin traded inside a clear parallel down-channel, with each lower high aligning along the descending trendline and tightening pressure on buyers. The price rejected mid-channel levels at $107,500, $102,500, and $97,500 before sliding toward the channel’s base.
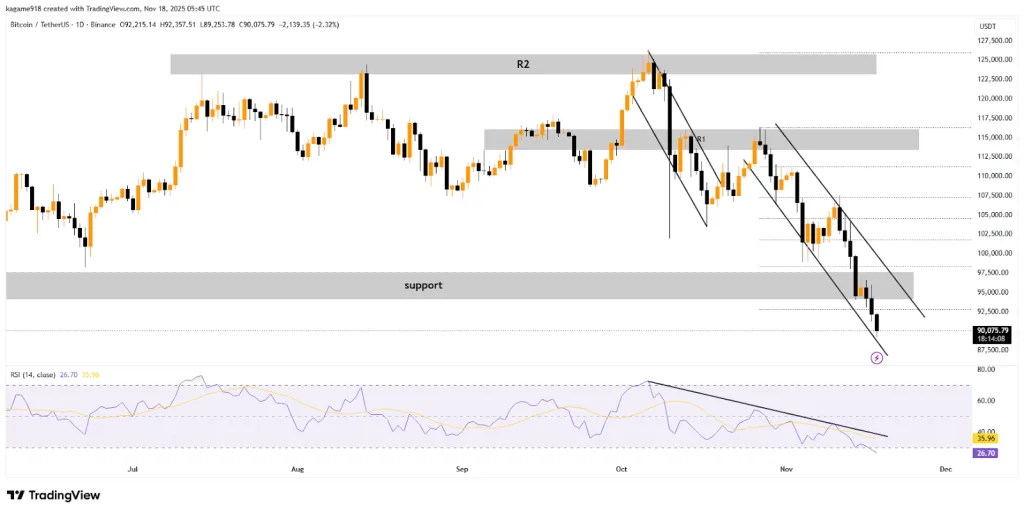
The RSI (14) is at 26.70, marking its lowest reading since mid-year. The indicator moved along a clear downward trendline from early October’s peak near 65, showing sustained weakening momentum through the decline.
Bitcoin Sees Record Holder Demand as Accumulation Surges
Bitcoin’s 30-day permanent holder demand has surged to its highest level on record, even as the market faces a broad selloff, according to new data posted by CryptoQuant. The chart shows a sharp rise in permanent holder demand, climbing from the 11K–15K zone to above 100K.
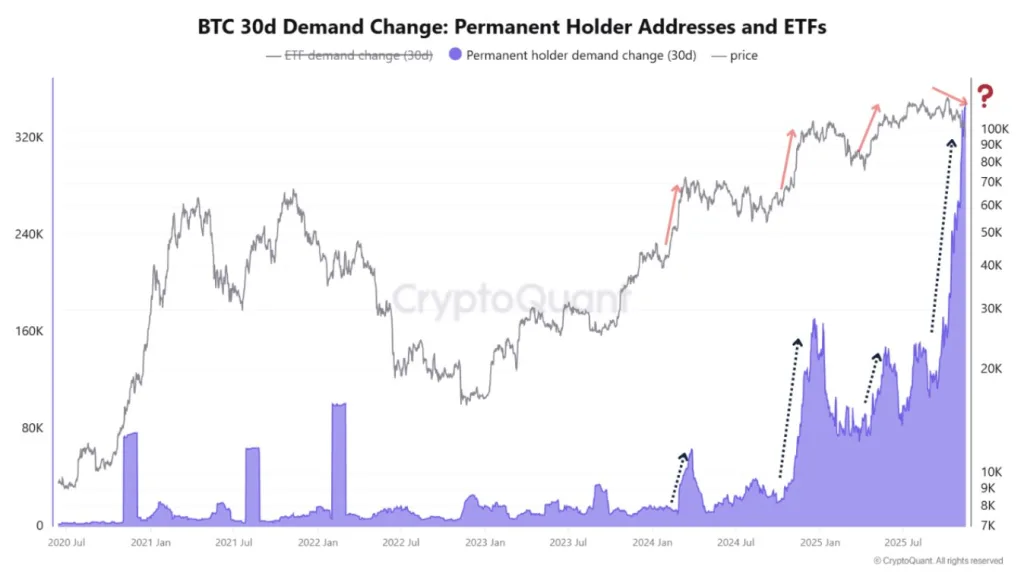
Analyst @MorenoDV_ described the move as “the biggest BTC accumulation in the middle of a selloff,” noting that long-term capital appears to be absorbing supply while short-term sentiment continues to deteriorate.
In the entire dataset, every significant increase in demand corresponds to the price reactions in 2024 and 2025, marked by repeated red arrows on the price line. The ongoing decline around the $90K–$100K level does not seem to have affected the buying activity of long-term holders, which now equals the levels of larger-scale accumulation periods.
Related: Bitcoin Falls Toward Key Levels as Liquidations Strike Hard
Supply Ratios Fall to Levels Below Prior Bear-Market Bottoms
Analyst Onchain College noted that STH supply fell below the –95% loss band, pushing the STH Supply Profit/Loss Ratio toward 0.01. This level only appeared during the 2018 and 2022 bear market lows.
The dataset showed that positive STH spikes frequently moved inside the 10 to 100 ratio range, while extreme losses dropped below 0.1 during deep stress periods. The latest reading, highlighted in red at the chart’s edge, aligned with severe STH distress.
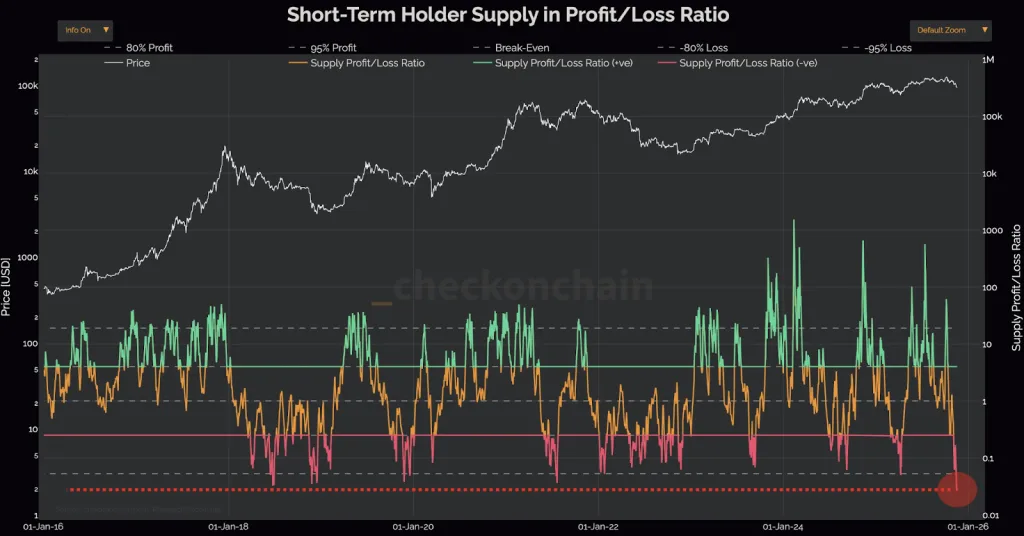
This decline raised a question for market observers: Could severe STH losses near record lows signal an approaching structural shift? Onchain College stated that these loss levels reached points lower than the last two bear-market bottoms, challenging the belief that recent bearish sentiment across X correctly captured the cycle top.
Moreover, in the long term, the accumulation of Bitcoin during deep market stress has been a forerunner of significant trend shifts. The present demand situation indicates that, in spite of the fierce short-term volatility, Bitcoin might still have a stabilizing floor.