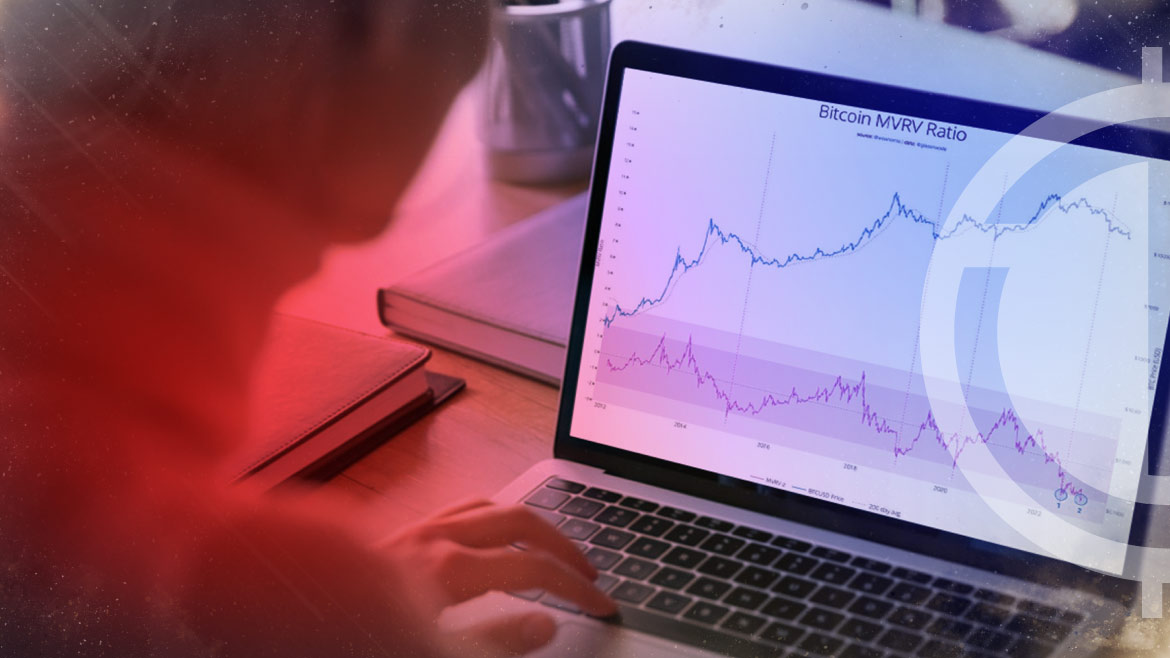
The bitcoin price has been under pressure since April’s drop, but with the break below $16500 now behind us, we’re seeing an increasingly sustained effort to establish support at this level. There are a few technical indicators that suggest the crash might finally be over and that we’ve entered a period where the market has bottomed and is keen to turn around.
The most powerful support level so far has been the 200-day moving average, which hasn’t yet let go of bitcoin price. This is a key indicator for identifying an uptrend or downtrend; once it’s lost, bullish momentum can be decomposed quickly and we see a selloff. This hasn’t happened yet, however, and with the rate at which bitcoin price is creating new support (purple zone), I think we’ll soon see it break above $16500 in a sign of strength.
Another strong indicator for us is the MVRV ratio, which has been increasing steadily over the past month alongside bitcoin prices. One of the best ways to measure liquidation is to look at how much it costs miners to sell their rewards. The MVRV ratio computes this by taking the market price and dividing it by the realized value (mining cost) over a 30-day rolling window. When we start seeing higher ratios, that means it’s cheaper for miners to sell, which suggests that many miners are liquidating their rewards. This ratio has even been pushing up against 5 recently, a strong indicator that the price will eventually react positively and start printing bearish reversals.
In summary, bitcoin price analysis suggests that we’ve likely hit an obvious bottom and it’s time to start looking for reasons to buy.
What does technicals suggest about BTC?
The RSI, MACD, and other technical indicators suggest that we may have hit a bottom in the bitcoin price and that the market is poised to turn around. The 200-day moving average, which acts as a key support level, has held up well so far, while the MVRV ratio suggests that there is an ample supply of mining rewards waiting to be liquidated.

The Ichimoku indicator, which measures momentum and volatility, is also pointing towards a possible bullish reversal. Based on these indicators, I believe that there are signs of strength brewing in the bitcoin price and that now may be an ideal time to buy. However, it’s important to remain cautious and closely monitor market developments to ensure that you’re making the right investment decisions.
The SMA, RSI, and other technical indicators are essential tools for any investor looking to trade in bitcoin. While there may be no clear signals yet, it’s important to watch these indicators closely and to be cognizant of market conditions when making buying or selling decisions. Ultimately, the best strategy is one that combines fundamental analysis with technical analysis to get the most accurate picture of the market and maximize your trading opportunities.
Conclusion
Overall, the bitcoin price appears to be bottoming out and may be poised for a bullish reversal. While there are no clear signals yet, key technical indicators such as the 200-day moving average and the MVRV ratio suggest that we could see increased buying pressure soon. As such, investors should keep a close eye on these indicators and be prepared to enter the market at reasonable times to capture any potential price movements.


