
Bitcoin has experienced major price fluctuations and several prolonged bear markets. However, one indicator that may indicate that a bottom is approaching is the significant increase in Bitcoin’s UTXO volume over the past week or so.
This movement typically occurs when bitcoin approaches its bottom in a market cycle. While Bitcoin’s price may not immediately recover after this movement, historically it has been a sign that the worst of the bear market is over and a new bull market may be on the horizon.
Some key technical indicators that experts are paying attention to in order to predict Bitcoin’s future price movements include momentum indicators, volume analysis, and moving averages. UTXO stands for unspent transaction output and is an important indicator for Bitcoin price movements as it indicates how many Bitcoin are actively being held by users.
Analysts believe that the increasing UTXO volume over the past week or so may be a sign that Bitcoin has found its bottom in this current bear market cycle.
Despite the prolonged bear market, Bitcoin has seen an increase in UTXO volumes that are estimated to have been bought in one week to one month. This is not uncommon, as similar movements were also observed during previous bear markets. In 2015, Bitcoin hit a bottom of around $185, while in 2018 it reached a low of around $3,100.
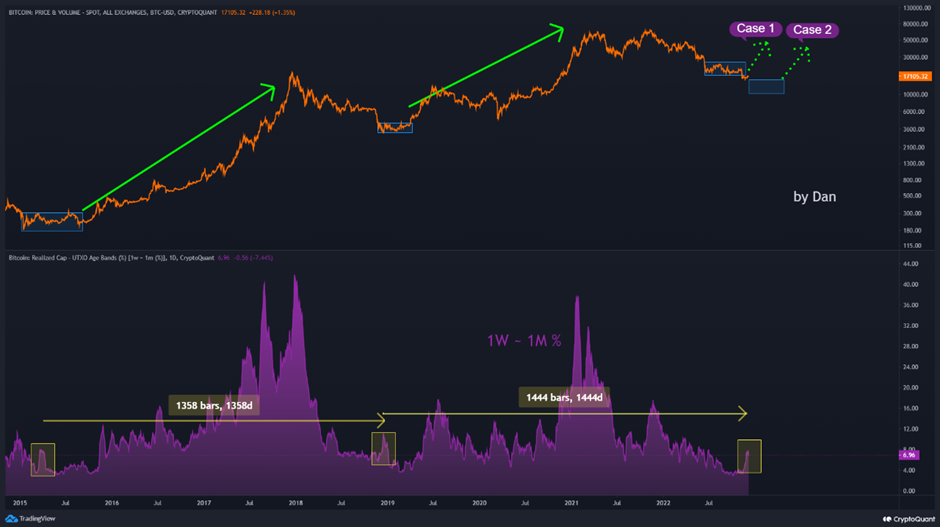
It is currently in the midst of another bear market, with Bitcoin prices around $16,000.While bull markets have not yet been started, this could be a sign that bitcoin has hit its bottom and that prices are likely to rise soon.
Bitcoin price analysis
Bitcoin is trading at $16,831.38 after failing to remain above $17,000.The recent price action shows Bitcoin is trading in a narrow range, but key indicators such as momentum and volume may offer clues to future price movements.
Traders are also closely watching technical indicators such as moving averages and Bollinger Bands, which can provide useful insight into bitcoin’s price action. For instance, on the daily chart, the Bollinger bands are narrow, suggesting bitcoin is in a period of low volatility.
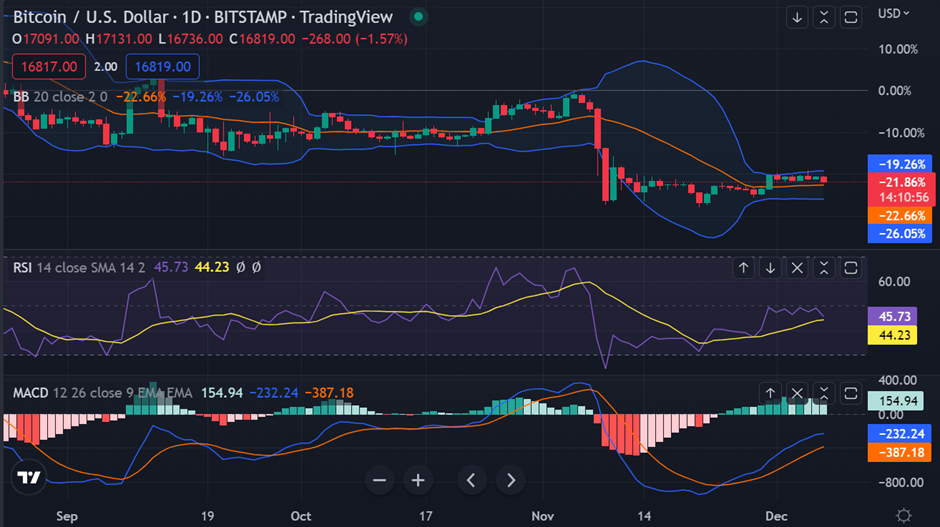
Meanwhile, on the monthly chart, bitcoin’s relative strength index (RSI) is neutral and its moving averages are trending upwards. This suggests that bitcoin may be poised to break out of its current range and move toward new highs. Thus, many analysts believe Bitcoin may be close to bottoming out and that we may soon see a new bull market in Bitcoin.
The current support levels for Bitcoin are $16,100 and $15,000. On the other hand, bitcoin’s resistance levels are at $17,000 and $18,000. The Exponential Moving Average (EMA) of 200 also appears to be providing Bitcoin with some support while bitcoin’s price remains below the Moving Average Convergence and Divergence (MACD).
Overall, bitcoin appears to be broadly consolidating in a range between $15,000 and $18,000. This suggests that bitcoin could encounter increased volatility in the near future as it attempts to break out of this trading range. While bitcoin may experience some short-term pullbacks, most experts agree that bitcoin will likely continue to climb higher in the long run as it approaches its next bull market.