![]() 19 Nov, 2022
19 Nov, 2022
![]() 22 Nov, 2023
22 Nov, 2023

Bitcoin price analysis for today shows that the cryptocurrency has experienced a bearish run, hitting an all-time low of $16,636. The market opened today at $16,631 .85 but quickly fell to $16,564.61, which appears to be the strong support level for BTC/USD. However, resistance still exists at $16,801.26, and if this level is broken, we may see the price of Bitcoin continue its downward trend. Although the bulls dominated the market the previous day, it seems that the bears have once again taken over and pushed Bitcoin to new lows.
Looking at Daily Bitcoin pricing, we can see that the price of Bitcoin has been steadily dropping over the last 24-hour. The BTC/USD has lost over 0.67% in the last 24-hours, as further bearish pressure on Bitcoin pushes the price down.
Bitcoin price action:Coinmarketcap
Price has moved below the 9 and 21-day moving averages, but remains in touch with the crucial 50-day exponential moving average (EMA) at $16,633.
Furthermore, the 24-hour relative strength index (RSI) shows a distinct decline at 38.7, which indicates that the market is oversold and that we may see some short-term uptrends soon. Moreover, the moving average convergence divergence (MACD) curve can be seen forming lower lows to move further below the neutral zone in a bearish divergence.
BTC/USD daily chart:TradingView
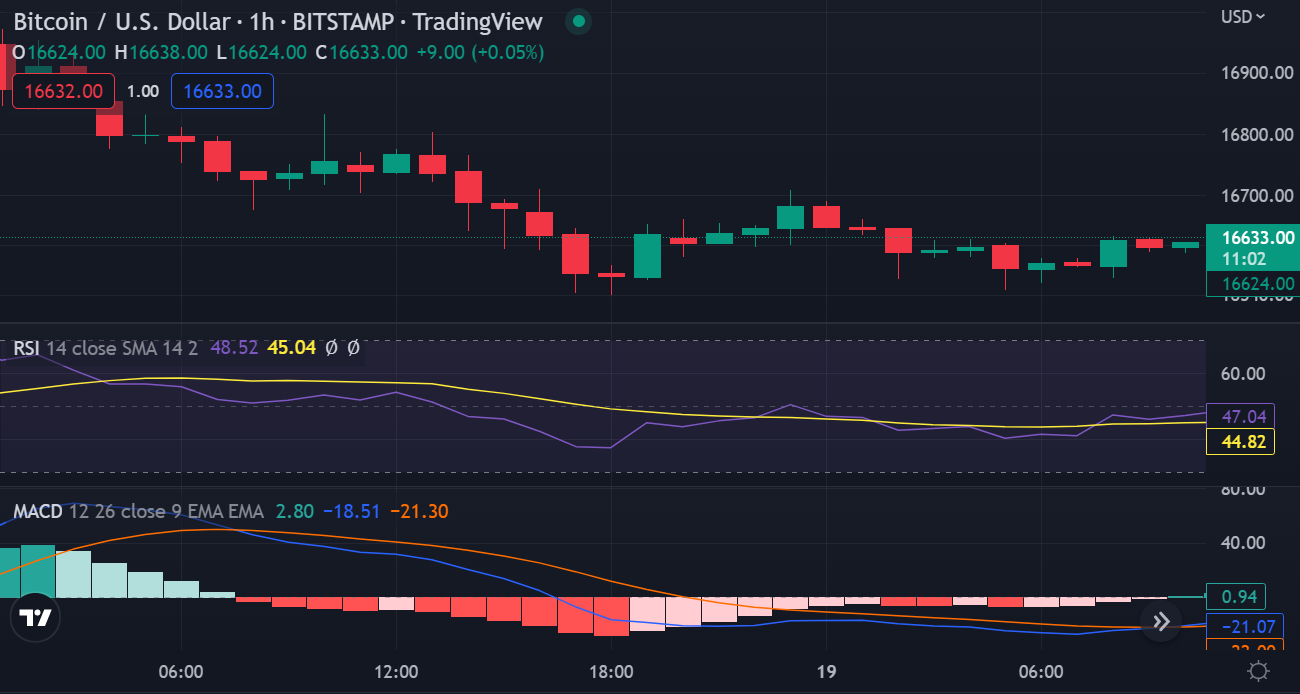
The hourly Bitcoin price analysis shows that Bitcoin is currently trading in a very narrow range, with support at $16,564.61 and resistance at $16,801.26. While the market appears to be relatively stable in this range, for now, it is important to keep an eye on any potential developments that could trigger a breakout from this zone.
BTC/USD hourly chart:TradingView
The Bulls may need to take some measures in order to prevent further losses if the price falls below $16,564.61 and enters into a downward trend.
The 50-hour EMA is currently at $16,633.00 and could act as a crucial support level. with the current price moving below 9 and 21-day moving averages and RSI declining, we may see Bitcoin price continue its downward trend in the coming days. The MACD is also showing lower lows, indicating that the bears are in control of this market, as the signal line moves further below the 0-line.
In conclusion, Bitcoin price is currently facing a bearish trend and could continue to decline in the coming days. The key support and resistance levels will be crucial for traders to watch out for as they try to predict future movements in the price of Bitcoin.
Share:
X