
Gala is currently poised for a potential breakout after a period of consolidation as highlighted by World Of Charts, an analyst. Analyzing the price chart, several key indicators suggest bullish momentum building up.

The chart reveals a descending trendline, acting as a formidable resistance barrier since the price peaked in March. This trendline has consistently pushed the price down whenever approached, indicating a strong selling pressure at these levels. However, recent movements show Gala inching towards this trendline once again, hinting at a possible breakthrough.
Besides the declining trendline, the chart also shows a horizontal section, or rectangle box, which denotes a period of sideways movement. In this range, Gala’s price has been moving from a support level near $0.046 to a resistance point of $0.054. The repeated testing of the support level suggests significant buying interest whenever the price dips, reinforcing its strength.
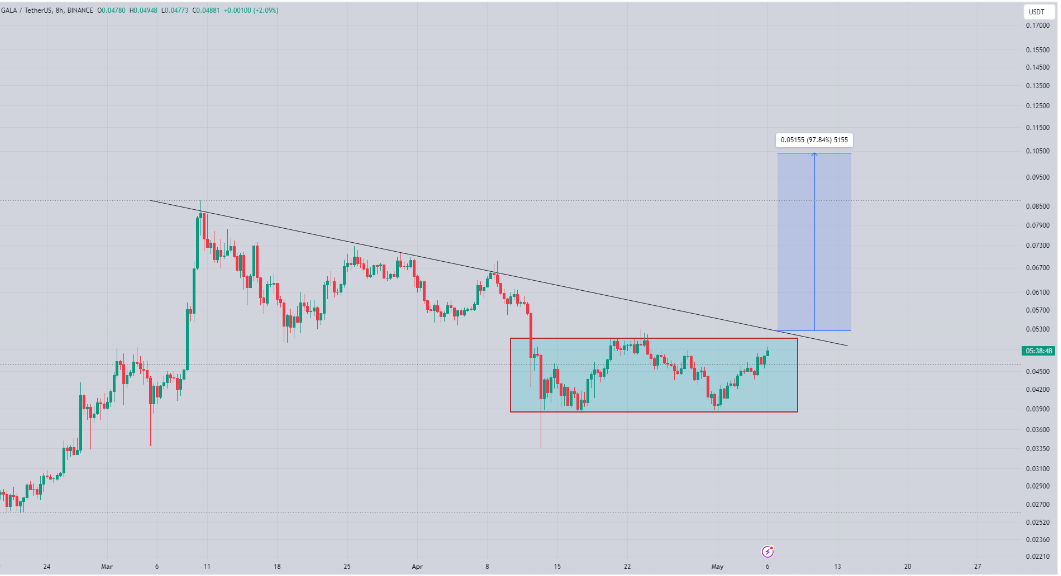
As Gala approaches the upper boundary of the consolidation range, there’s anticipation for a potential breakout. If the price manages to breach this resistance, coupled with surpassing the descending trendline, it could trigger a solid bullish rally. The target projection post-breakout is approximately $0.0695, implying a substantial increase of around 57.6% from the breakout point.

Data drawn from the current market indicates that Gala is trading at a price of $0.047495, with the recorded 24-hour trading volume of $133,209,142. Gala has recorded a hike of 6.52% over the past 24 hours which indicates that investors have regained such interest in it. The 1 Day Relative Strength Index (RSI) is currently at 48.97 which is indicative of neither extreme overbought nor oversold conditions although nearing oversold territory. Traders can watch for available buying opportunities when the RSI reaches 30.
In addition, the 1-Day Moving Average Convergence Divergence (MACD) is above the signal line, indicating a possible bullish trend. This alignment indicates upward momentum in Gala’s price movement. Nonetheless, the 1-Day Average Directional Index (ADX) now stands as 14.07 and suggests a weak market trend in either direction at the moment.


