Bitcoin Volatility Triggers $200M Liquidations in 75 Minutes

- Bitcoin erased nearly $200M in 75 minutes as bulls and bears were liquidated in succession.
- A $1,700 drop wiped out longs before a $1,400 rebound liquidated short positions fast.
- RSI at 43.99 signaled fading momentum as options expiry and thin liquidity amplified swings.
Bitcoin endured a violent 75-minute swing that erased nearly $200 million in leveraged positions, as rapid price moves punished traders on both sides. Market commentator Bull Theory reported that the asset fell from $66,710 to $65,000 in 60 minutes, wiping out more than $185 million in long positions.
The analyst then said price reversed sharply and climbed from $65,000 to $66,400 in 15 minutes, liquidating nearly $14 million in shorts. Combined, the move brought total liquidations to roughly $199 million across the full window.
The sequence illustrated how quickly thin weekend liquidity can distort price action when leverage is crowded. Bull Theory described the event as another low-liquidity weekend flush that removed both bullish and bearish traders in quick succession.
Based on the levels cited, the first leg lower amounted to a drop of about 2.5%, while the rebound delivered a gain of roughly 2.2%. Even after the recovery, the asset remained below its starting point, showing that the rebound did not fully erase the earlier damage.
Derivatives’ Pressure Added to the Shock
The volatility came during a period of broader derivatives stress. Deribit settled about $14.16 billion in options on March 27, a figure analysts described as the largest options expiry of 2026. The expiry was also said to equal roughly 40% of open positions on the exchange.
TradingView News reported that the market sat around $4,700 below a $75,000 max-pain level before expiry. That gap mattered, as large expiries can intensify hedging flows and exaggerate short-term swings.
In the same period, the asset was said to have fallen as low as $655,420, representing a 5.18% session decline. The reported figure appeared alongside the broader options-driven volatility narrative.
Separately, macro pressure remained visible as Middle East tensions, firmer Treasury yields, and a stronger U.S. dollar weighed on risk assets. More than $1.33 billion in crypto positions were liquidated over the week, while the price traded near $66,510 on Friday.
Related: Crypto Is the Future of AI-Native Payments, Says Sam Bankman-Fried
Chart Data Showed Weakening Momentum
The TradingView chart shared with the move placed the current action inside a long-term ascending channel. The chart highlighted earlier cycle advances toward $19,000, $68,000, and $126,000, followed by deep corrective phases.
Those pullbacks included declines of 84% to around $3K and 77% to roughly $15K. The latest retracement has pulled BTC’s price back into the $60K to $70K zone. The current correction area on the chart suggested that support could extend toward the $40K region if the long-term trendline is tested. Momentum readings also weakened.
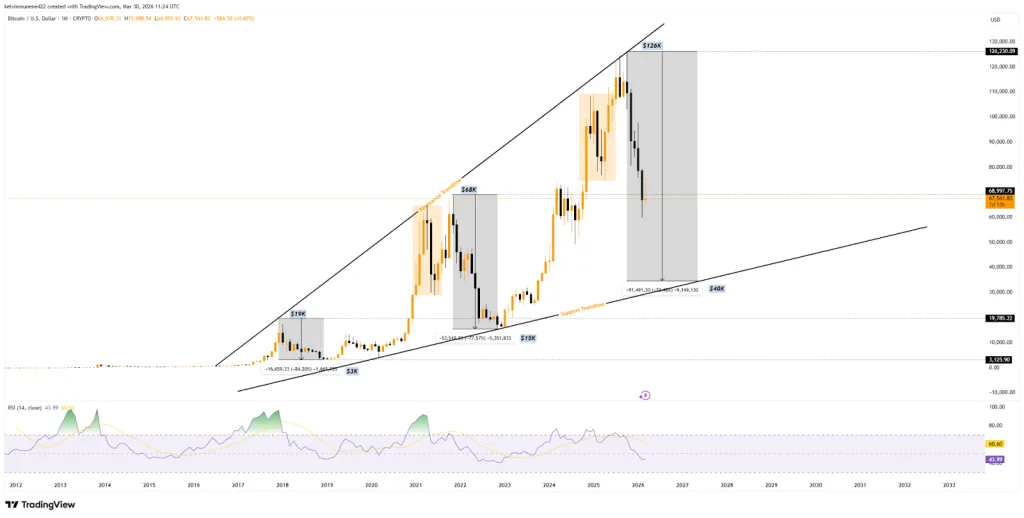
The RSI 14 stood near 43.99, while its moving average was around 60.60. With RSI below the neutral 50 mark, the indicator signaled fading bullish momentum and rising bearish pressure. The chart data showed that such readings have previously aligned with extended consolidation or deeper downside before a fresh accumulation phase.
Overall, the liquidation wave showed how fragile Bitcoin’s short-term setup had become as leverage, weak RSI, and options pressure collided. Although BTC rebounded sharply after the drop, it still closed below its starting level, signaling that bullish momentum remained weak. Traders are now watching whether Bitcoin can hold the mid-$60,000 zone or face deeper downside toward lower channel support.