
Bitcoin, a leading cryptocurrency, has recently tested the crucial support and resistance level at $62,000. Captain Faibik, a renowned crypto analyst, highlighted this activity in a recent X update. He predicts that the next few months will be remarkable for Bitcoin’s market performance.
The analysis shows Bitcoin maintaining a strong bullish stance as it continues its upward trend. Over the past months, the digital currency has formed an ascending triangle pattern, indicating potential for further price advances.
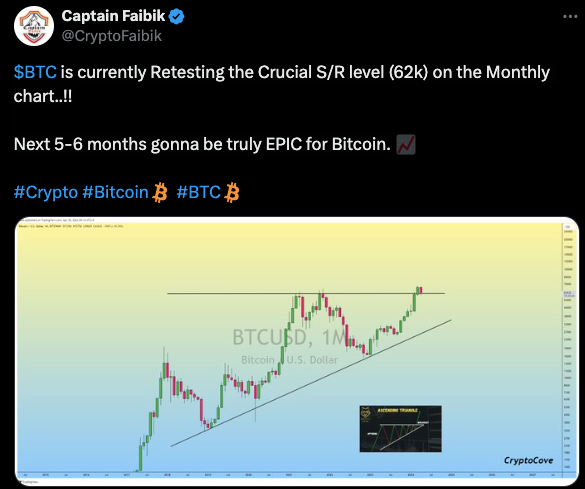
Captain Faibik pointed out the significance of the recent resistance test. Bitcoin has slightly surpassed this mark, sparking speculation among traders about the establishment of a new support level. If the support holds, this could propel the cryptocurrency to higher prices.
Crypto analyst Ali recently highlighted an intriguing trend in X’s post regarding Bitcoin’s price movements. He noted that the Bitcoin short-term holder realized price currently stands at $59,800. Historical data shows that Bitcoin typically rebounds from this level during an uptrend. However, dipping below this threshold could lead to significant price corrections for the cryptocurrency.
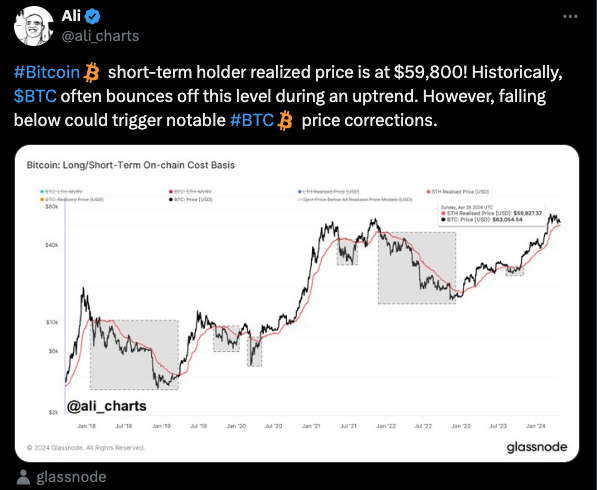
In-depth crypto analytics, drawing from Glassnode’s data, have shed light on Bitcoin investment patterns. This analysis contrasts the on-chain cost basis for long-term holders (LTH) and short-term holders (STH) against Bitcoin’s actual price trends from January 2018 through January 2024.
The data visualized shows the LTH cost basis in black, which reflects the average purchase price for long-term Bitcoin investors. The STH cost basis is depicted in red, outlining the average purchase price for those holding their Bitcoins for shorter periods. It’s interesting to note that the cost basis for STH often surpasses that of LTH, particularly at the peak of Bitcoin’s price surges.
As of January 24, 2024, Bitcoin’s market price was recorded at approximately $30,045.94, while the realized price stood at $40,827.37. This gap indicates a discrepancy between the current market value and the average transaction price, hinting at underlying trends in investor behavior and market sentiment.
The chart also features a Realized Price (USD) line, which represents the average price at which all Bitcoins have changed hands, factoring out those considered lost. This metric is crucial for understanding the overall profit or loss status within the market.
Over the past 24 hours, Bitcoin’s value has experienced a modest increase, climbing 1.37% to reach a current price of $63,284.23. This recent uptick is part of a broader recovery observed in the cryptocurrency market following a volatile trading session earlier in the day.
The market capitalization of Bitcoin now stands at approximately $1.25 trillion, marking a 1.46% increase. This growth underscores a resilient demand for Bitcoin amidst fluctuating market conditions. Additionally, trading volumes have surged by 38.31%, totaling around $26.59 billion in the last day. This significant volume indicates a high level of trading activity and investor interest.