


- The $70,000 resistance level emerges as a critical barrier to Bitcoin’s bullish momentum.
- A symmetrical triangle pattern hints at an imminent significant price movement.
- The 200-period EMA at $65,600 stands as a bulwark, reinforcing bullish sentiments.
Bitcoin is currently the focal point of a nuanced analysis conducted by a crypto market analyst, Crypto Faibik. This analysis paints a picture of optimism, as it has been observed that Bitcoin bulls are vigorously defending a significant technical threshold.
The 200-period exponential moving average (EMA) on the 4-hour chart, resting at approximately $65,600, acts as a fortress against downward pressures. Moreover, a bullish pennant formation is in the spotlight, hinting at potential upward price movements.
Within this intricate web of market movements, a crucial resistance level is identified at $70,000. Surmounting this level is deemed essential for Bitcoin to maintain its upward momentum. The analysis, as presented by Captain Faibik, introduces a compelling narrative through a chart.
This chart elucidates a pattern bolstered by key support levels, underscored by an ascending trendline. The repeated interactions with this trendline, marked by orange arrows, underscore a consistent price point where buyers eagerly accumulate Bitcoin, offering robust support.
Adding complexity to this analysis is a descending trendline, sketching out a symmetrical triangle. This geometric figure suggests a period of price consolidation characterized by lower highs and higher lows.
Such a formation typically culminates in a significant price movement. Captain Faibik’s predictions are visually represented by a red zig-zag line, indicating a possible breakout and a subsequent retest of the triangle’s boundaries.
Embedded within this analytical narrative is the mention of an EMA, illustrated by a teal line. Market participants traditionally interpret this line’s position beneath the current price level as a bullish indicator.
This exploration of Bitcoin’s market dynamics underscores the intricate dance between buyer enthusiasm and technical indicators. As the digital currency treads through these technical landscapes, market watchers remain glued to the charts, anticipating the next significant move.
Over the past 24 hours, Bitcoin has seen a slight decline in value, slipping by 1.23%. The price of Bitcoin hovers around $66,168 at press time. Despite this dip, the cryptocurrency’s market capitalization holds strong at approximately $1.3 trillion, maintaining its top position in the market. Trading activity surged, with a notable 13.62% increase in 24-hour volume, totaling around $46.29 billion.
As the world’s leading digital currency encounters these fluctuations, market participants are keeping a watchful eye on the price trends, especially with the upcoming halving event marked to occur in 17 days. This event typically influences Bitcoin’s value and the broader market sentiment.
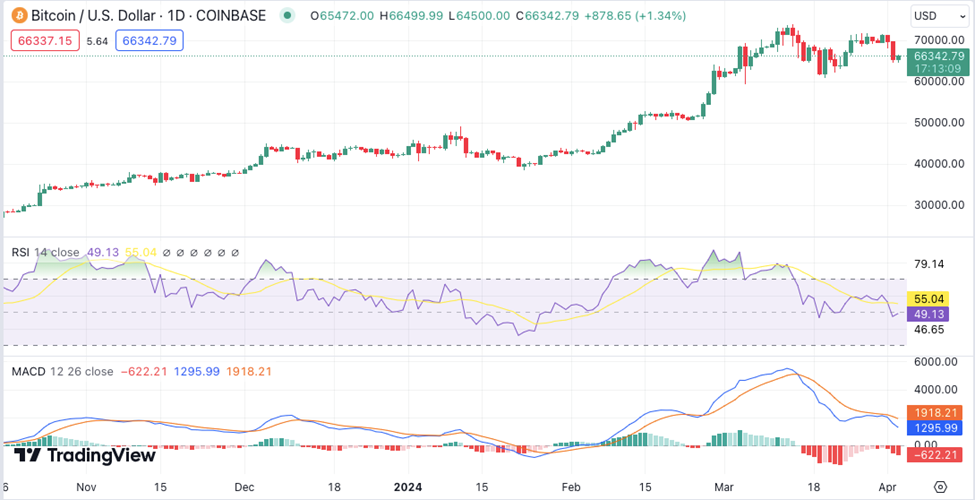
The Relative Strength Index (RSI) is currently positioned at 49.13, indicating a neutral trend. Further analysis reveals that the Moving Average Convergence Divergence (MACD) reflects a negative momentum with its current value at -622, hinting at potential bearish sentiment in the market. Despite this, the MACD’s histogram showcases shorter bars than prior ones, potentially signaling a decrease in negative momentum.


