


- Bitcoin’s failure to hold above $65,600 and its struggle with key technical levels suggest increased short-term volatility.
- The 200EMA on the four-hour chart remains crucial for Bitcoin’s price stability, signaling potential rebounds or further declines.
- The upcoming halving event adds to the uncertainty surrounding Bitcoin’s trajectory, complicating its short-term outlook.
Bitcoin, the leading cryptocurrency, is currently navigating a crucial phase following its recent breakout attempt. With a price currently hovering around $65,521 and a 24-hour trading volume exceeding $47 billion, Bitcoin has witnessed a notable decline of 6% in the last 24 hours. This downturn has prompted concerns among investors and analysts regarding its short-term trajectory.
One significant observation is the failure of Bitcoin’s post-breakout retest, indicating a potential shift in momentum. As per Rekt Capital, an analyst, despite the possibility of a recovery above the previous all-time high of approximately $69,000 before the new weekly candle close, Bitcoin must first hold the weekly range low of around $65,600 to safeguard its current range. However, achieving this stability seems challenging amid the current market conditions.
As highlighted by Ali Martinez, another prominent analyst, the 200EMA (Exponential Moving Average) on the Bitcoin four-hour chart emerges as a crucial level to monitor closely. Since early February, it has served as formidable support, preventing significant downside movements. This level’s significance lies in its ability to either guarantee a rebound if held or signal further losses if breached, as observed in mid-January. Consequently, Bitcoin’s price action in relation to this indicator could offer valuable insights into its short-term direction.
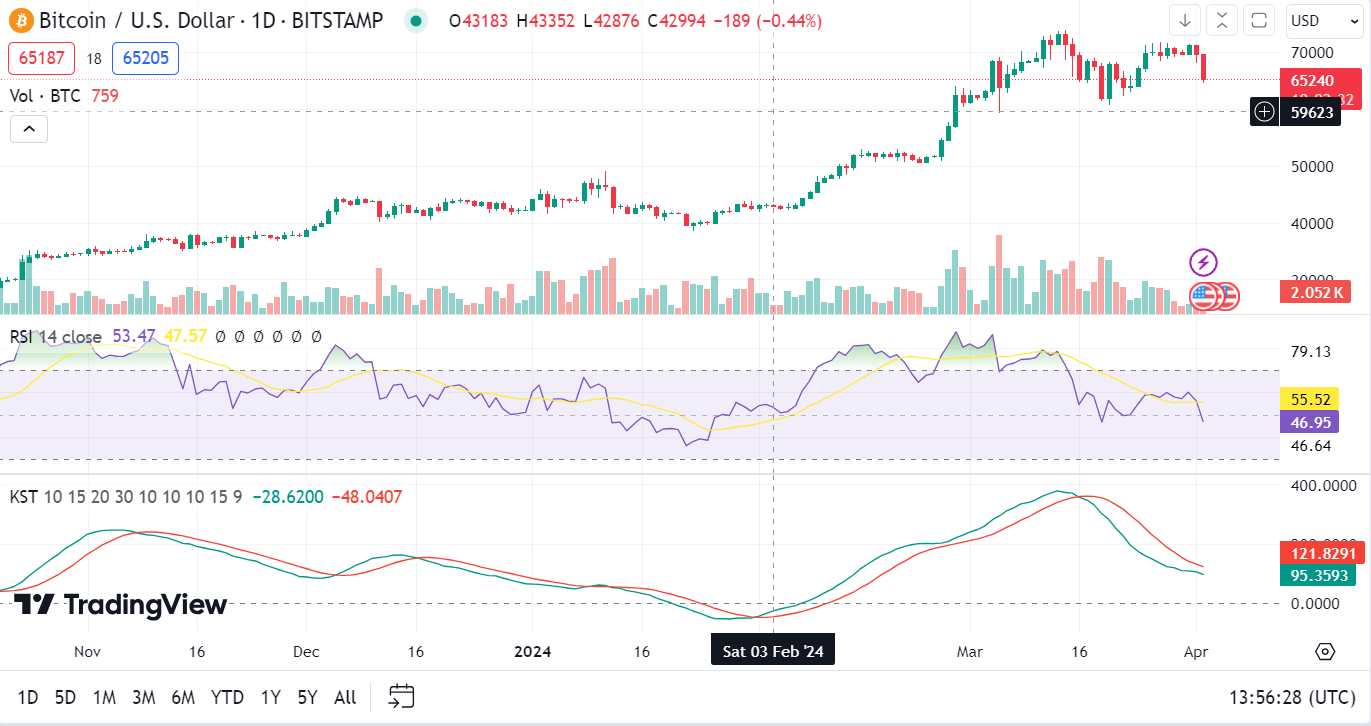
Examining Bitcoin’s one-day Relative Strength Index (RSI) reveals a reading of 46.60, indicating a neutral position. While this suggests a potential shift in momentum in the near future, trading below the signal line could signify a downward trend if sustained. Similarly, a one-day KST (Know Sure Thing) trading below the signal line could reinforce a bearish sentiment, especially if prolonged over an extended period.


