
- Bitcoin’s resistance at $43,004.75 suggests a potential downward trend if the level isn’t breached soon.
- Equilibrium points and technical indicators like the EMA and SMA provide crucial support levels for Bitcoin.
- Analysis of the weekly and monthly timeframes indicates an overbought Bitcoin, signalling possible future corrections.
In a recent video by Cheeky Crypto, the crypto analyst delved deep into Bitcoin’s price action, analysing its current trends and possible future movements. The comprehensive technical analysis spanned multiple timeframes, including hourly, daily, and weekly charts, offering valuable insights into Bitcoin’s volatile market behaviour.
The video analysis begins with an observation of Bitcoin’s volatility, particularly noting the recent movements that saw the cryptocurrency’s price fluctuating between lows of around $40,222 and highs nearing $43,475. The analyst pointed out a critical resistance level at $43,004.75, where Bitcoin failed to break through, indicating a potential downward trend.
The analysis also highlighted Bitcoin’s position at an equilibrium level, a midpoint between a premium and a discounted range. This equilibrium often acts as a pivot point for Bitcoin’s price, offering support or resistance. The analyst noted that Bitcoin currently finds itself at this crucial juncture, which could determine its short-term trajectory.
On the technical front, the analysis discusses the significance of the 50-day Exponential Moving Average (EMA), the 50-day Simple Moving Average (SMA), and the 200-day EMA. Traders closely watch these indicators and are currently providing Bitcoin with some support. However, as per smart money concepts, the broader market sentiment still points towards a bearish structure on the hourly timeframe.
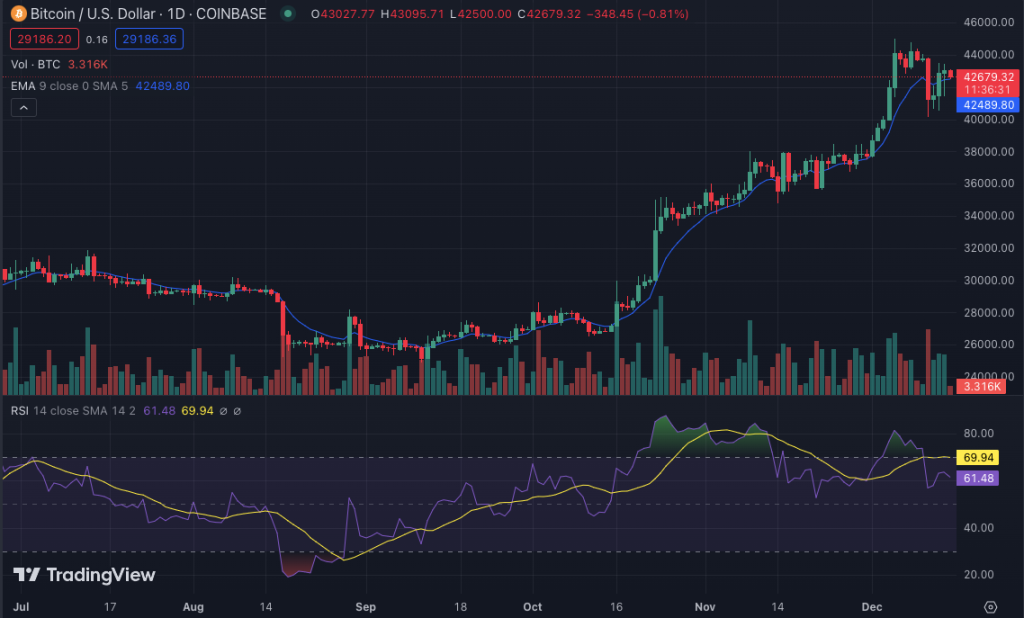
The stochastic Relative Strength Index (RSI), a momentum indicator, is also examined. It currently suggests the possibility of Bitcoin finding support and rallying beyond the $43,004.75 mark. Nevertheless, the presence of a bearish divergence, as identified earlier, cautions against overly optimistic predictions.
Moving to the daily timeframe, the analysis identifies a resistance zone between $42,986 and $45,456, with current price action hovering in the middle. The expectation is for a correction to the downside, but not before testing slightly higher ranges. The analyst emphasised the importance of watching for potential support around the $39,600 to $40,000 range, with further support levels identified down to the $35,735 to $37,650 range. At the press time, BTC is currently at $42,697, with a slight decrease of 0.91% in the past 24 hours.
On the weekly chart, the analysis outlines a parallel channel with key support areas between $36,622 and $37,717 and $30,330 and $31,818. These levels are considered pivotal in determining Bitcoin’s longer-term price direction. The video also discussed the potential for significant price corrections based on historical data and overbought conditions as indicated by the stochastic RSI.
The monthly analysis further reinforced the view of an impending correction. Historical patterns suggest that when Bitcoin is this overbought, a downturn is typically on the horizon. The analyst concluded by highlighting the importance of closely monitoring these trends and preparing for possible significant price movements in Bitcoin’s market in the upcoming months.