
Bitcoin stands at a crossroads, with critical decisions looming over its price trajectory. At the current juncture, the digital asset hovers around $61,778.08, experiencing a slight dip of 1.76% in the last 24 hours, amidst a trading volume of $26.1 billion.
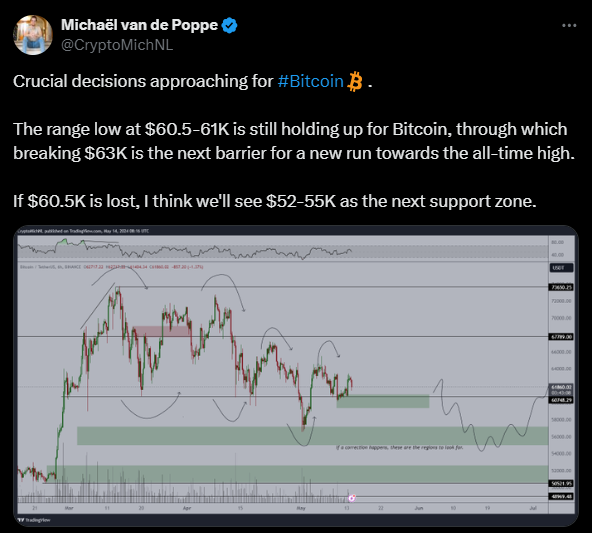
As per Michaël van de Poppe, a top analyst, the prevailing sentiment among market participants revolves around the pivotal range between $60.5K and $61K, which has thus far served as a sturdy support for Bitcoin.
However, attention is now turning towards the crucial barrier at $63K, the breach of which could potentially ignite a fresh rally towards the coveted all-time high. Conversely, should the support at $60.5K falter, projections point towards a descent to the $52-55K range, marking the next significant support zone.
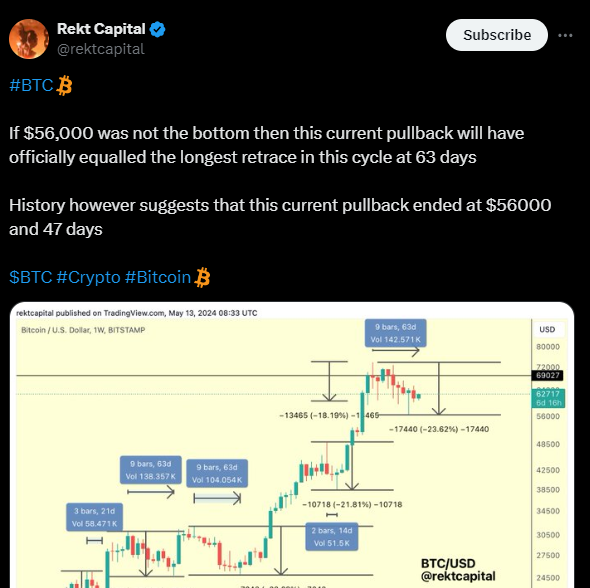
As further highlighted by Rekt Capital, a prominent analyst, the dip to $56,000 signaled the culmination of the correction, spanning a duration of 47 days. Others contend that should the current retracement persist, it would match the longest retrace in this cycle, lasting a staggering 63 days. Nonetheless, historical patterns suggest that Bitcoin may be on the brink of completing a comprehensive reset, a notion supported by several technical indicators.
According to analysis by Jelle, an analyst, a return to the 100-day Exponential Moving Average (EMA) coupled with a bullish crossover in the Moving Average Convergence Divergence (MACD) below the zero line infuses optimism among bulls. Additionally, the emergence of the first higher low in a prolonged period underscores a potential shift in momentum favoring the bulls.
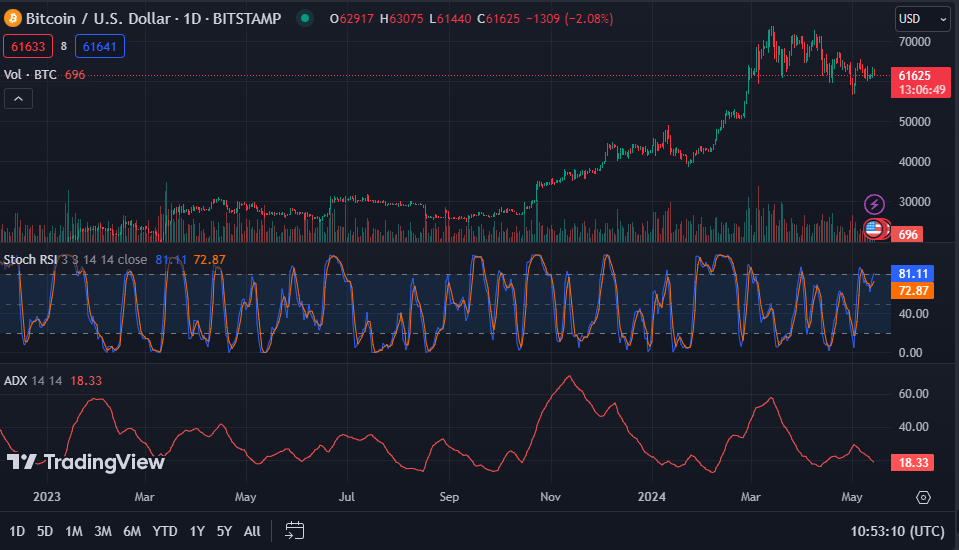
Bitcoin’s 1-day stochastic Relative Strength Index (RSI) indicates overbought conditions, signaling a potential impending price correction. Moreover, the MACD trading above the signal line signifies rapid price appreciation, potentially hinting at an imminent pullback. Furthermore, the Average Directional Index (ADX) reading of 18.33 suggests a lack of strong trend momentum, implying a likelihood of consolidation or even a reversal in the near future.