BONK Price Bounces Off Support at $0.0000089: Is $0.00001 Next?

- BONK defended rising support near $0.0000089 as price structure tightened below $0.00001.
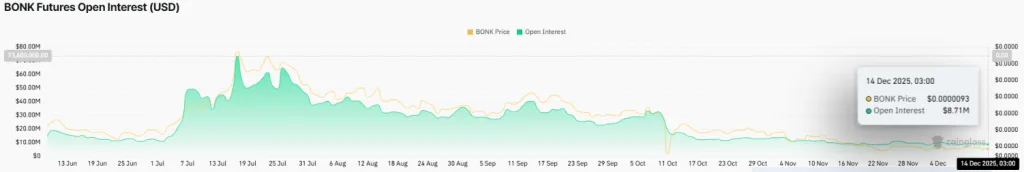
- Low futures open interest near $8.7M signals reduced leverage and muted volatility.
- Failure to reclaim $0.00001 keeps downside risk active despite tightening supply.
BONK staged a modest rebound after testing a key technical support level, drawing renewed attention to whether the meme token can reclaim the psychologically important $0.00001 mark. Recent price action shows BONK navigating a tightly compressed structure, with both technical and derivatives data pointing to a market at a critical inflection point rather than a clear directional trend.
BONK Defends Rising Support After Intraday Dip
BONK rebounded from a well-defined support zone between $0.0000090 and $0.0000088, as shown on the 4-hour TradingView chart. During Sunday’s session, the price briefly declined to $0.0000089, aligning with the lower boundary of a rising trendline and the 23.6% Fibonacci retracement.
This area has provided repeated support since late November, reinforcing its technical relevance. Following the intraday low, BONK’s price reversed higher early Monday, advancing nearly 5% to test the $0.0000094 region. However, selling pressure emerged quickly at that level, causing the price to retrace part of the move within hours.
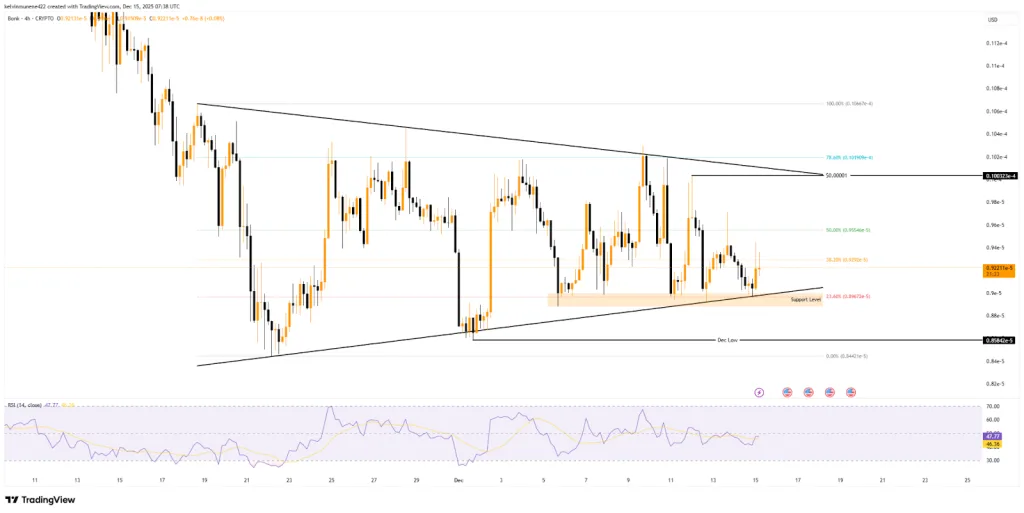
At press time, BONK’s price was trading near $0.0000092, reflecting a marginal 0.12% decline over the past 24 hours. The muted daily change highlights a broader phase of consolidation rather than trend expansion.
Compressed Structure Signals Pending Directional Move
The broader price structure remains constrained within a converging range. A descending trendline from early December continues to cap upside attempts, while higher lows keep forming along the rising support line.
This narrowing formation suggests declining volatility, a condition that historically precedes stronger directional moves. Fibonacci retracement levels define nearby resistance zones. The 38.2% retracement sits near $0.0000092, while the 50% level is located around $0.00000955. Both levels have recently acted as friction points for price advances.
The $0.00001 level stands out as the most critical threshold, combining psychological importance with technical resistance from the descending trendline. On the other hand, momentum indicators remain neutral.
The Relative Strength Index is hovering around 47, below the midpoint of 50, signaling neither overbought nor oversold conditions. Trading volume has also stayed below recent averages, reinforcing the view that the market is waiting for confirmation before committing to a larger move.
Derivatives and On-Chain Data Reflect Low Leverage Environment
Derivatives data support the consolidation narrative. BONK futures open interest has been moving sideways near $8.7 million, a sharp contrast to mid-year levels that exceeded $70 million. The subdued open interest indicates limited leverage participation, which helps explain the absence of sharp price swings despite short-term rebounds from support.
On the other hand, on-chain and exchange flow data point to a tightening liquid supply. Netflows show consistent withdrawals from exchanges into cold wallets, suggesting that holders are reducing readily available supply.
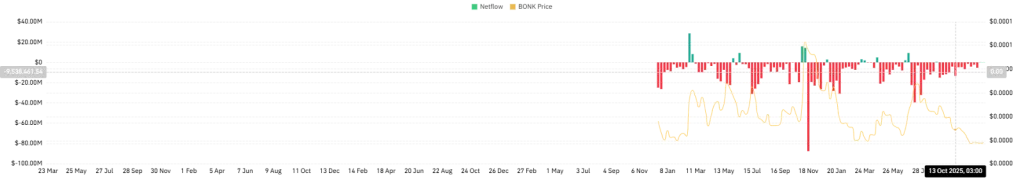
While this behavior can help stabilize price levels, the data shows it has not yet translated into strong upward momentum or aggressive buying pressure.
Related: Ethereum Bear Breakdown Risk Grows Despite Accumulation
Higher-Timeframe View Keeps Focus on $0.00001
Additional context comes from a higher-timeframe analysis shared by CryptoPatel on X. The 3-day BONK/USDT chart shows BONK breaking below the long-standing $0.00001 support and now retesting it as resistance.
According to the analysis, this breakdown-and-retest structure has historically preceded large directional moves. CryptoPatel identifies a resistance band between $0.000010 and $0.00001125. As long as BONK trades below this zone, the structure remains bearish.

Failure to reclaim $0.00001 could open the path toward a deeper retracement between $0.00000450 and $0.00000350, a zone that aligns with a previously identified bullish order block. Such a move would represent a 50% to 70% decline from current levels.
On the upside, the analysis defines a clear invalidation point. A confirmed breakout above $0.00001250 would shift the market structure bullish, with historical expansions on the chart projecting potential upside of 200% to 400%. Until then, the $0.00001 level remains the primary dividing line between bearish consolidation and renewed bullish continuation.