
Ripple’s XRP has been subject to intense scrutiny and speculation. Traders and investors are closely monitoring key indicators to gauge the potential direction of XRP’s price movement. Recent price action, coupled with technical analysis, offers insights into the current state of the market and potential future trends.
As per Egrag Crypto, an analyst, over the past weeks, XRP has encountered significant resistance around the 21 exponential moving average (EMA), particularly following a notable decline on April 8. However, recent price movements have shown a semblance of bullish momentum, with two bullish candles amidst two bearish ones since the aforementioned dump.
Analysts suggest that closing above the 0.57 cent mark on a weekly basis could signal bullish sentiment, while dipping below 0.50 cents may invite a bearish outlook, potentially disrupting the existing market structure.

Examining the price trend, XRP currently stands at $0.5184, experiencing a marginal decline of 0.74% within the last day. This modest fluctuation signifies a phase of consolidation, where the price oscillates within established upper and lower bounds.
The support level, identified around $0.513, signifies a psychological threshold where buyers may perceive value, anticipating an upward price movement. Conversely, the resistance level near $0.5222 indicates a barrier where selling pressure intensifies, potentially stalling further price appreciation.
Of notable significance is the surge in trading volume, witnessing a 16.90% increase, totaling approximately $964,375,261 over the past 24 hours. This uptick in volume suggests heightened market activity, which could precede a breakout or confirm the current range-bound movement. The volume-to-market cap ratio, standing at 3.36%, provides insights into market liquidity and trader sentiment, influencing future price dynamics.
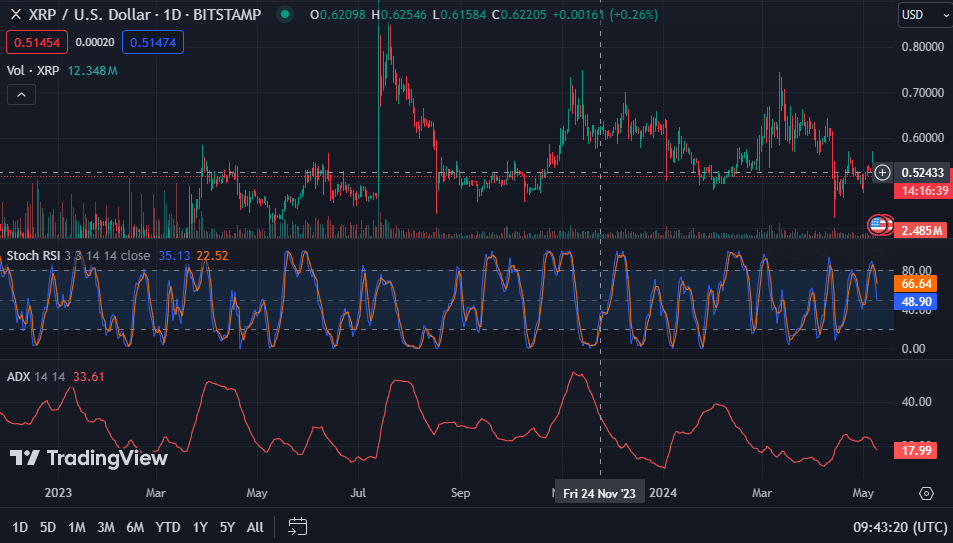
Technical indicators offer mixed signals regarding XRP’s short-term trajectory. While the stochastic Relative Strength Index (RSI) on the daily chart reads 48.70, signaling a potential bearish trend, the Moving Average Convergence Divergence (MACD) remains above the signal line at -0.00843, indicating continued bullish momentum. Additionally, the Average Directional Index (ADX) reads 17.96, suggesting a lack of a clear trend in XRP’s price movement.