
Binance Coin (BNB) is up to a noticeable extent, justifying a bullish sentiment among traders and investors. Analyzing the recent price movements, it becomes evident that BNB has witnessed a robust upward momentum, marked by a succession of green candlesticks on the weekly chart. The current week’s candlestick, with “3d 18h” remaining, indicates a continuation of this bullish trend, hinting at further potential gains.
As per Crypto Tony, a top analyst, a critical aspect of this uptrend lies in the breaking of the $662.00 resistance level, a significant milestone for BNB. This breach suggests a shift in dynamics, with the possibility of this former resistance level now transforming into a new support level at a higher price range. This development underscores the resilience and strength of BNB’s current market position, potentially paving the way for sustained upward movement.
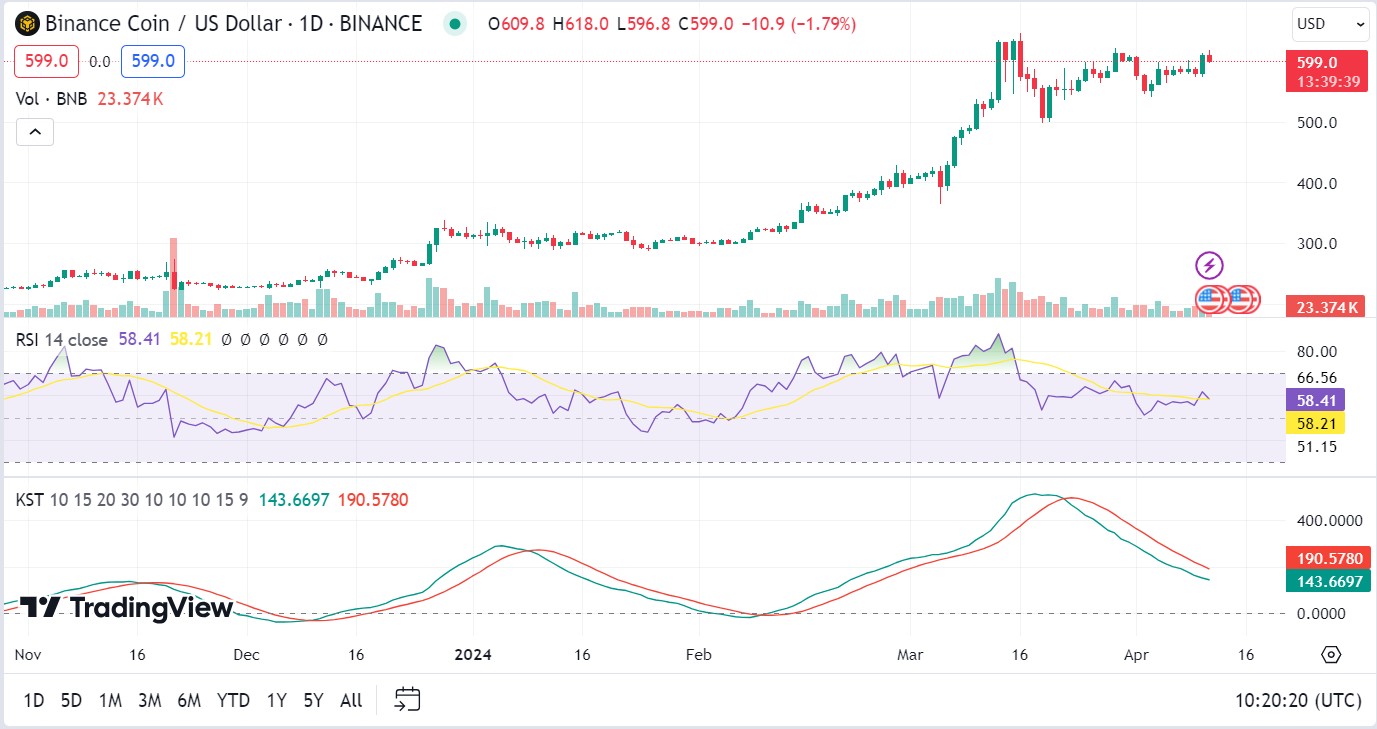
Examining the technical indicators provides additional insight into BNB’s current market conditions. With the 1-Day RSI reading at 58.08, BNB appears to be in neutral territory, neither overbought nor oversold. This neutrality implies a balanced market sentiment, leaving room for further price exploration in either direction.
However, caution may be warranted as the 1-Day MACD trades below the signal line, indicating a short-term bearish trend. Similarly, the 1-Day KST also signals a potential continuation of the downward trajectory, highlighting the importance of vigilance in navigating BNB’s price movements.
Despite the bearish signals within a short time, it is still pertinent to see BNB’s overall performance in the long run. The coin’s resilience to market fluctuations and ability to create new support levels at higher price ranges indicate its future growth. Additionally, the current live BNB price of $597.64, accompanied by a 24-hour trading volume of $1,799,810,682, reflects sustained investor interest and liquidity in the asset.