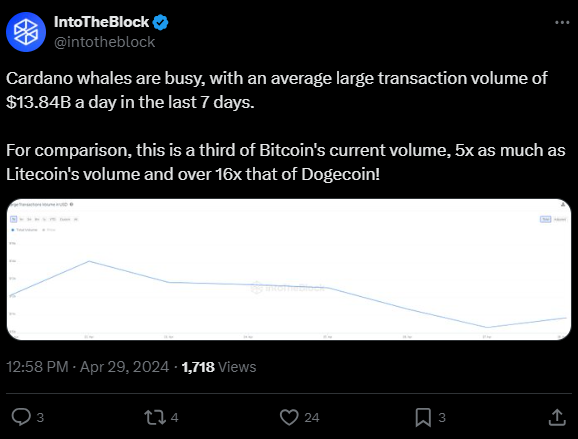
Cardano has witnessed significant activity among its whales lately as per IntoTheBlock data. These large holders have been engaging in transactions averaging a whopping $13.84 billion daily over the past week. Such a substantial transaction volume underscores the active participation of major players in the Cardano ecosystem.
For instance, Cardano’s transaction volume is approximately a third of Bitcoin’s current volume. It surpasses Litecoin’s volume by a significant margin, being five times greater. Moreover, Cardano’s transaction volume exceeds that of Dogecoin by over 16 times, illustrating its substantial presence in the market.
Analysts and traders alike are closely monitoring Cardano’s price movements, anticipating potential opportunities for buying or selling. A notable observation is the impending rejection point and a sharp downward trend, indicating a possible price dip. This scenario aligns with the strategy of ‘buying the dip,’ a tactic favored by many investors to capitalize on short-term market fluctuations.
Projected price targets suggest potential buy zones at $0.34 and $0.26, representing significant discounts from the current price of $0.454112. Should the price dip to these levels, investors with available cash could seize the opportunity to accumulate Cardano tokens at a lower cost. While such a move entails short-term risk, it also presents the potential for substantial gains in the long run.
As reported by CryptoTale, Cardano has faced a slight setback in its holder count, witnessing a marginal decline of 0.1% over the past three months, totaling approximately 4.7 million holders presently. This stabilization comes amidst a broader market sentiment leaning towards a downtrend for Cardano, as evidenced by a recent dip in its Funding Rate to -0.0010%.
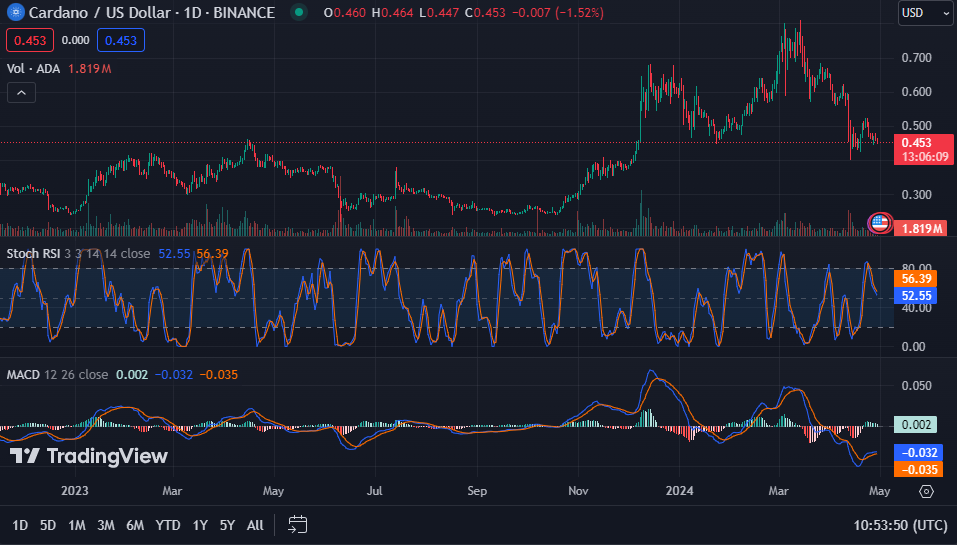
Technical indicators offer additional insights into Cardano’s market sentiment. The 1-day stochastic RSI reading below the signal line indicates a neutral stance in the short term, implying the possibility of either a bullish or bearish move. Meanwhile, the 1-Day MACD trading above the signal line suggests a slight bearish momentum, prompting traders to exercise caution and seek confirmation from other indicators.