
Bitcoin is currently navigating a crucial juncture in its price trajectory. Market participants are closely monitoring its movement as it grapples with key resistance levels and seeks to maintain its bullish momentum.
In recent sessions, Bitcoin experienced a notable bounce from a liquidity zone, reaffirming the significance of technical levels in influencing price action. As highlighted by CryptoCapo, an analyst, the digital asset encountered resistance at the $65,000 mark, prompting speculation among traders regarding its next move.
Analysts opine that Bitcoin is poised to break through this resistance barrier in due course. Should this scenario materialize, price targets of $68,000 to $69,000 emerge as initial objectives, followed by the $74,000 to $75,000 range. Nevertheless, market sentiment remains contingent upon various factors, with a bearish invalidation looming should price action falter at previous range lows.
As further noted CryptoBusy, a top analyst, a critical aspect of Bitcoin’s current chart dynamics is the presence of a downward trendline, delineating a path of resistance characterized by successive price retreats upon testing. This trendline serves as a pivotal indicator for traders, accentuating the importance of technical analysis in navigating volatile cryptocurrency markets.
Additionally, Fibonacci retracement levels offer valuable insights into potential price reversals and support/resistance zones. The 0.5 Fibonacci level, in particular, has historically served as a pivotal juncture, demonstrating Bitcoin’s propensity to react to these key levels as traders assess market dynamics.
At present, Bitcoin finds itself in a precarious position, with recent price movements signaling a pullback from the descending trendline and a breach below the 0.5 Fibonacci level. This suggests a continuation of bearish sentiment, with the 0.618 Fibonacci level emerging as the next potential support zone.

Key levels to monitor include the aforementioned Fibonacci retracement levels and the descending trendline, which remains a formidable barrier to overcome. As per Michaël van de Poppe, an analyst, a break above this trendline could signal a shift in market sentiment from bearish to bullish, potentially ushering in a new phase of price appreciation for Bitcoin.

A thorough examination of price trends highlights the importance of both support and resistance levels. Bitcoin encounters resistance notably around $67,789, with another significant hurdle in the range of $72,500 to $73,650. On the flip side, vital support levels exist at $60,478, along with a broader support zone ranging from $50,521 to $48,969, which has historically proven to be a resilient support area.
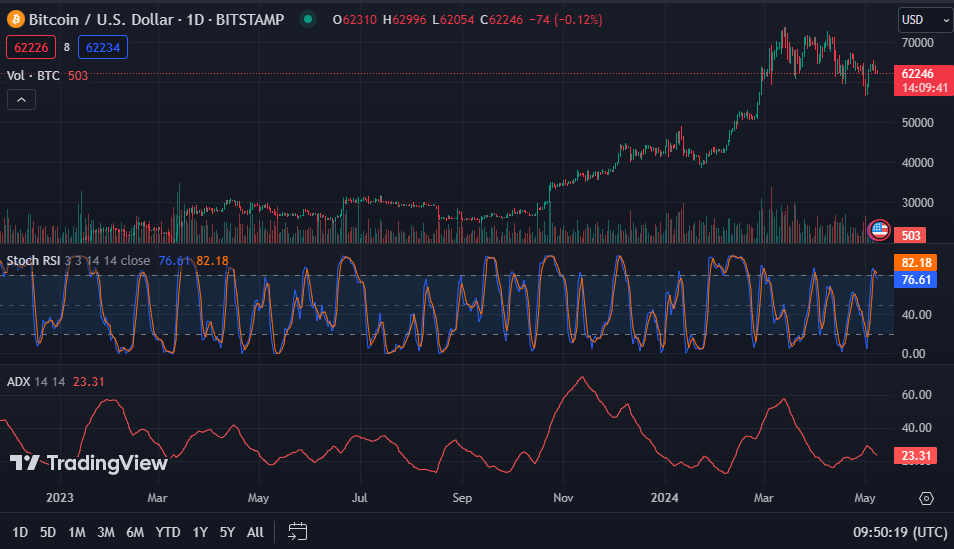
In evaluating market dynamics, volume and technical indicators offer additional insights into trader sentiment and potential price movements. Trading at $62,273.54, Bitcoin’s Stochastic Relative Strength Index (RSI) and Moving Average Convergence Divergence (MACD) signal potential overbought conditions and downward pressure, respectively, while the Average Directional Index (ADX) gauges trend strength.