XRP’s monthly Bollinger Bands have reached an unprecedented narrow width of 0.70, as pointed out by renowned crypto analyst Charting Guy. This measurement is the most constricted the bands have been, setting a new historical record for the cryptocurrency. Previously, the tightest width observed was 0.73 back in 2017, which was closely followed by a significant price surge.

According to Charting Guy’s analysis shared on X, this contraction in the bands might suggest a looming volatility spike for XRP. Historical trends indicate that such narrowness in Bollinger Bands typically precedes major price movements. While Charting Guy cautions that this could be speculative, the pattern observed in 2017, where a sharp increase followed a similar constriction in XRP’s value, suggests another potential upswing.
Over the past 24 hours, the digital currency market has seen some interesting movements. XRP has experienced a slight upturn in value, inching up by 0.61%, bringing its price to $0.5008.
The current market capitalization is approximately $27.6 billion, placing the digital asset in seventh place in terms of overall market cap. XRP has witnessed a substantial surge in trading activity, with a 25.56% rise in 24-hour trade volume, now at over $1.7 billion.
XRP has witnessed significant volatility in the market over the past week, oscillating between gains and losses. This ongoing battle between bullish and bearish forces resulted in an overall decline of 18%, pushing XRP to teeter just above the $0.5 threshold.
Despite this turbulence, the cryptocurrency has displayed a degree of price stability, suggesting a solid support level near this mark. In the previous month, XRP’s value fell by 17%, underscoring the crypto market’s inherent volatility. The past week saw prices fluctuating from $0.43 to $0.61, reflecting investor uncertainty.
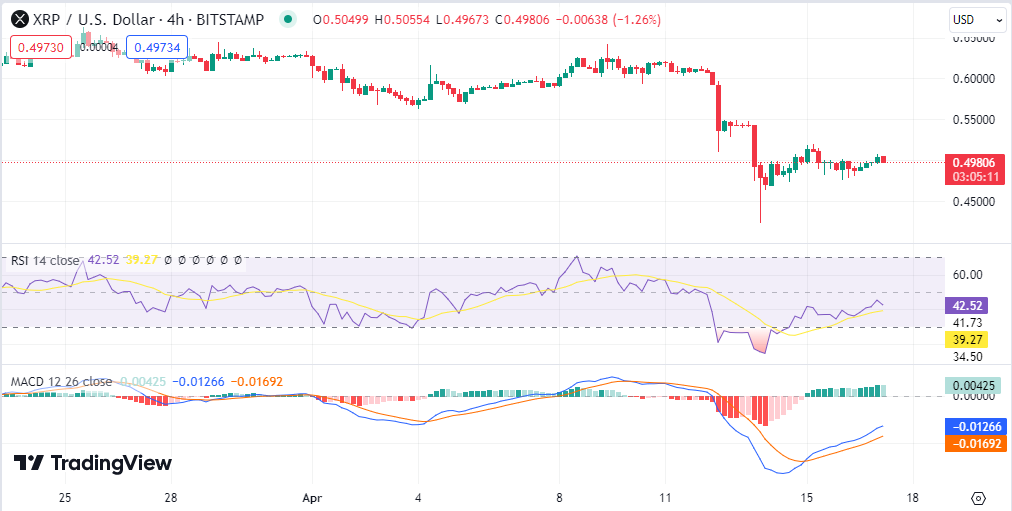
The Relative Strength Index (RSI), at 42.52, places XRP in a neutral territory, indicating a market equilibrium. Furthermore, the Moving Average Convergence Divergence (MACD) analysis suggests a balanced market dynamic, with the signal and MACD lines closely aligned, pointing to possible price shifts ahead.