
Chainlink is currently showing signs of a potential upswing, according to insights shared by crypto analyst Morecryptoonl. The analyst suggests that Wave c of 3 may unfold, with confirmation anticipated upon a break above the $21.74 mark. If this scenario unfolds, Wave c of 3 could surge to $23.25, aligning with the 100% extension of Wave A.
This analysis brings attention to the ongoing market dynamics of Chainlink, offering a perspective rooted in technical indicators. The breakthrough at $21.74 becomes a pivotal moment, signaling a potential bullish wave in the cryptocurrency’s trajectory.
The current analysis by Morecryptoonl sheds light on the intricate patterns within Chainlink’s market movements. Investors and enthusiasts should watch for the awaited breakthrough at $21.74, which could signify a significant uptrend for the cryptocurrency.
As of this writing, Chainlink is trading on a bullish outlook as bulls resist the downtrend. The bears have persisted in today’s session, pushing LINK toward the $20 mark. However, in the past few hours, the bulls have made a comeback as the price trend toward the immediate resistance formed at the $21 level. Currently, LINK is trading at $20.61, up by 0.85% in the past 24 hours.
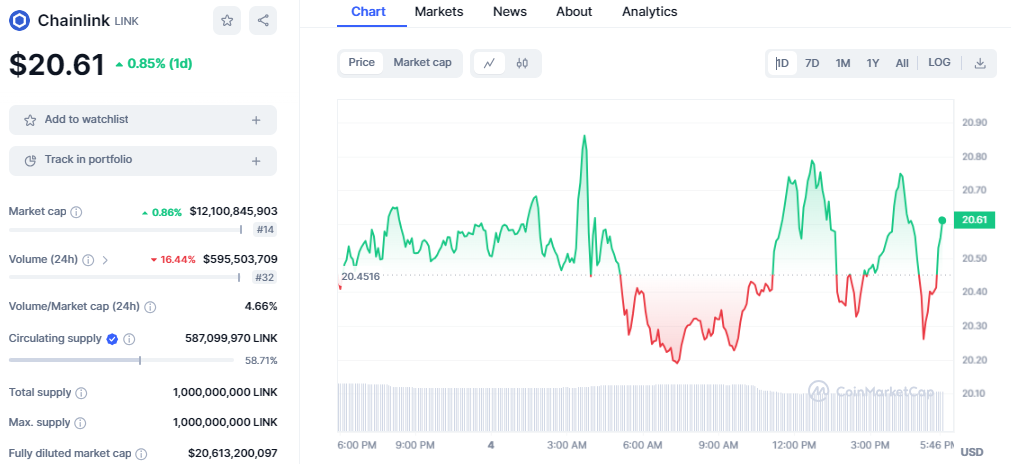
In the last week, Chainlink has witnessed substantial gains, trading between $18.9 and $27.9. The LINK token chart reflects a 9% increase over the past seven days. Despite attempts by the native INJ token to consolidate above $20, its market cap has seen a marginal increase of nearly 1%, settling at $12.1 billion.
Amidst increased price volatility and Bitcoin breaking through its $65,000 key level, the crypto industry is clearly under a robust bullish influence. Top tokens, including Ethereum, Solana, and Dogecoin, display significant valuation jumps.
On the technical indicators, the Moving Average Convergence Divergence (MACD) underscores this bullish trend with a consistent green histogram, signaling a positive price action for Chainlink soon. The 20-day Exponential Moving Average is below the current price, suggesting a buy signal.
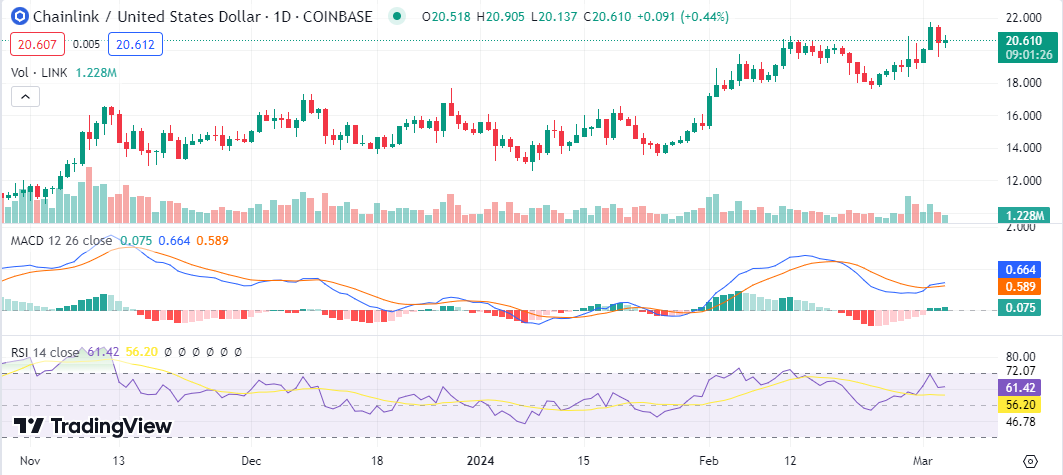
The Relative Strength Index (RSI) indicator has dropped from the overbought region as it currently hovers around the 60 index, indicating a shifting momentum as bulls lose ground.


