
Dogecoin, a popular Meme coin, is the subject of keen analysis by Ali, a seasoned cryptocurrency analyst. In a recent X post, Ali highlighted an intriguing development in the DOGE trading pattern. Specifically, the Bollinger Bands on the four-hour DOGE chart are experiencing unprecedented tightness, a phenomenon not observed since October 2023. Bollinger Bands are a widely recognized tool in cryptocurrency trading for analyzing market volatility.
At the time of writing, DOGE’s price stood at $0.07804, reflecting a notable decrease of 0.83% over the last 24 hours, indicating a slight downturn in market momentum. The cryptocurrency’s trading volume has reached a substantial $197 million, a sign of increasing investor engagement. Dogecoin’s market capitalization, at $11.15 billion, secures its position among the top ten cryptocurrencies.
In the past week, the Dogecoin price movement has been confined beneath a significant long-term trend line, fluctuating within the range of $0.0750 to $0.0900. Despite this volatility, market analysts maintain a positive outlook on DOGE’s future. The currency navigates a path marked by potential ups and downs, yet the broader market sentiment leans towards bullish prospects.
Recently, Dogecoin faced resistance in its attempt to breach the $0.0800 level. It has been challenged by the resistance zone around $0.07900, resulting in a minor decline, mirroring the trends seen in other major cryptocurrencies like Bitcoin and Ethereum. Dogecoin momentarily dipped below key support levels at $0.080 and $0.090, testing the $0.07800 zone.
Current market analysis suggests that if Dogecoin can sustain a closing price above the $0.0800 resistance, it might rebound to the $0.0900 mark, potentially reaching the crucial $0.095 level. Surpassing these resistance levels could propel Dogecoin toward the $0.1 threshold. This optimistic scenario hinges on Dogecoin’s ability to maintain upward momentum in the market.
On the flip side, should Dogecoin fail to eclipse the $0.0800 mark, it might face a downward trend. The immediate support lies around $0.0750, with a more critical support level at $0.0700. A break below this point could see Dogecoin sliding towards the $0.0710 level.
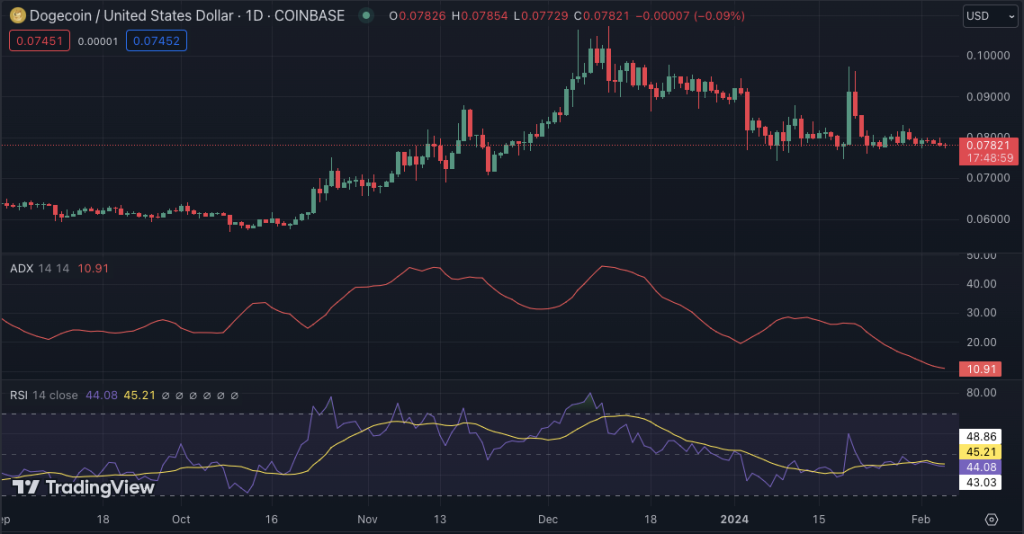
The Average Directional Index (ADX) currently stands at 19, suggesting a potential increase in market activity. However, the Relative Strength Index (RSI) for DOGE/USD, presently below the 50 mark, points to a neutral market position.