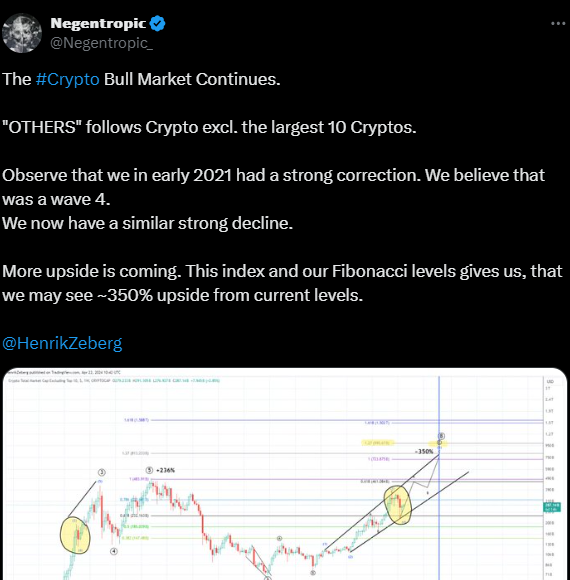
The ongoing bull market in the cryptocurrency space continues to capture attention and speculation, with intriguing patterns emerging that could signal substantial opportunities for investors. Recent analysis suggests that the market, particularly excluding the top 10 cryptocurrencies, is poised for significant growth despite recent corrections.
As highlighted by Negentropic, co-founders of Glassnode, in early 2021, the market experienced a notable correction, which analysts believe marked a wave 4 within an Elliott Wave cycle. Another substantial decline followed this correction, likely representing the start of a new wave pattern. However, the overall outlook remains positive, with forecasts indicating the potential for around 350% upside from current levels.
Elliott Wave Theory, a method of technical analysis used to understand market cycles, reveals an identifiable pattern of five waves within the market’s movement. Waves 1, 3, and 5 typically denote upward trends, while waves 2 and 4 reflect corrective phases. The current scenario is unfolding as a corrective ABC pattern, following a completed bullish wave 5.
A crucial aspect of this analysis is the application of Fibonacci retracement levels. These levels, derived from mathematical ratios, help identify potential support and resistance zones within price movements. Notably, key Fibonacci levels around 1.618 ($1,588 T) are anticipated to act as future resistance areas, influencing market behavior.
The observed percentage gains during the formation of previous waves underscore the market’s potential for strong bullish movements. For instance, a historical gain of +236% during wave 5 suggests robust upward momentum. Conversely, the forecasted -350% change during the current corrective phase signals a significant downturn.
The chart’s trend lines reveal a converging channel, with the lower line providing support and the upper line suggesting potential resistance. These trend lines serve as critical indicators for investors, highlighting key levels where market sentiment could shift.
In addition to technical indicators, support and resistance levels also play a vital role in understanding market dynamics. Horizontal lines on the chart denote these levels, often coinciding with psychological price barriers. For instance, the $1,500 T level is highlighted as a potential psychological resistance zone.
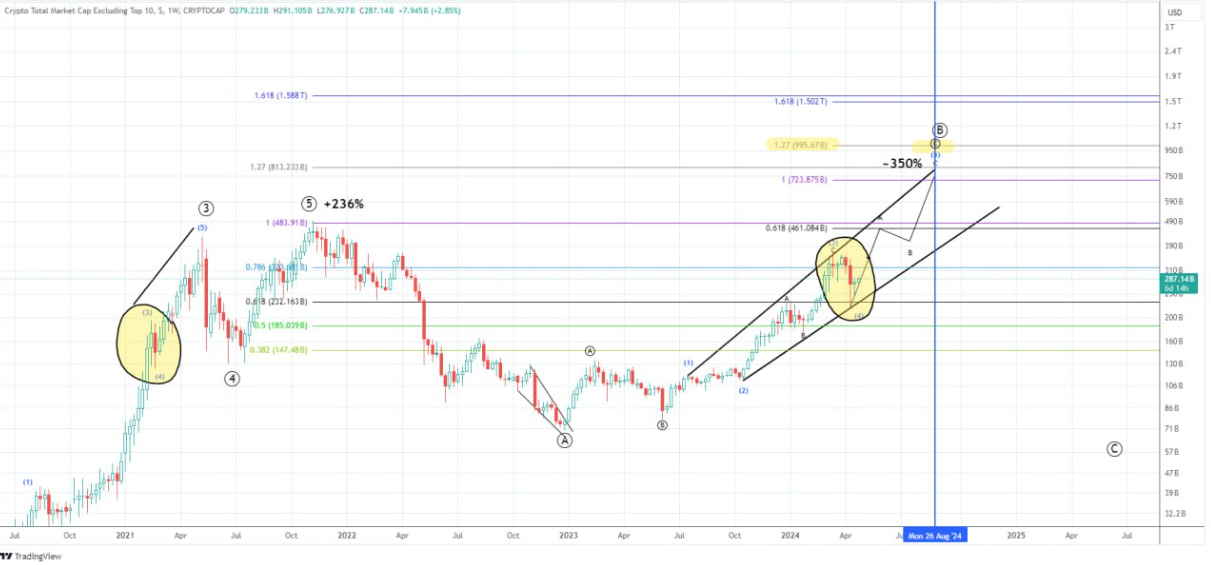
Market participants will closely monitor how prices interact with trend lines, Fibonacci levels, and identified support/resistance zones. The convergence of trend lines around mid-2024 is likely to mark a significant turning point, determining the market’s longer-term trajectory.