
An individual managed to turn a modest investment of 30.3 SOL (equivalent to $5.3K) into 5,906.4 SOL (approximately $1.03M) within the span of just one day on the Solana blockchain. This phenomenal gain, amounting to 195 times increase, underscores the dynamic and lucrative nature of cryptocurrency markets.
As highlighted by Lookonchain, an onchain analytic firm, the trader strategically allocated their SOL tokens to acquire 261.27 million units of EPIK Prime (EPIK), a promising asset within the Solana network. Subsequently, they adeptly capitalized on the market momentum, swiftly selling off 231.27 million EPIK for a substantial profit of 5,936.7 SOL, valuing at an impressive $1.04M. Such astute maneuvering within the volatile crypto landscape reflects not only the potential for substantial gains but also the inherent risks associated with these markets.
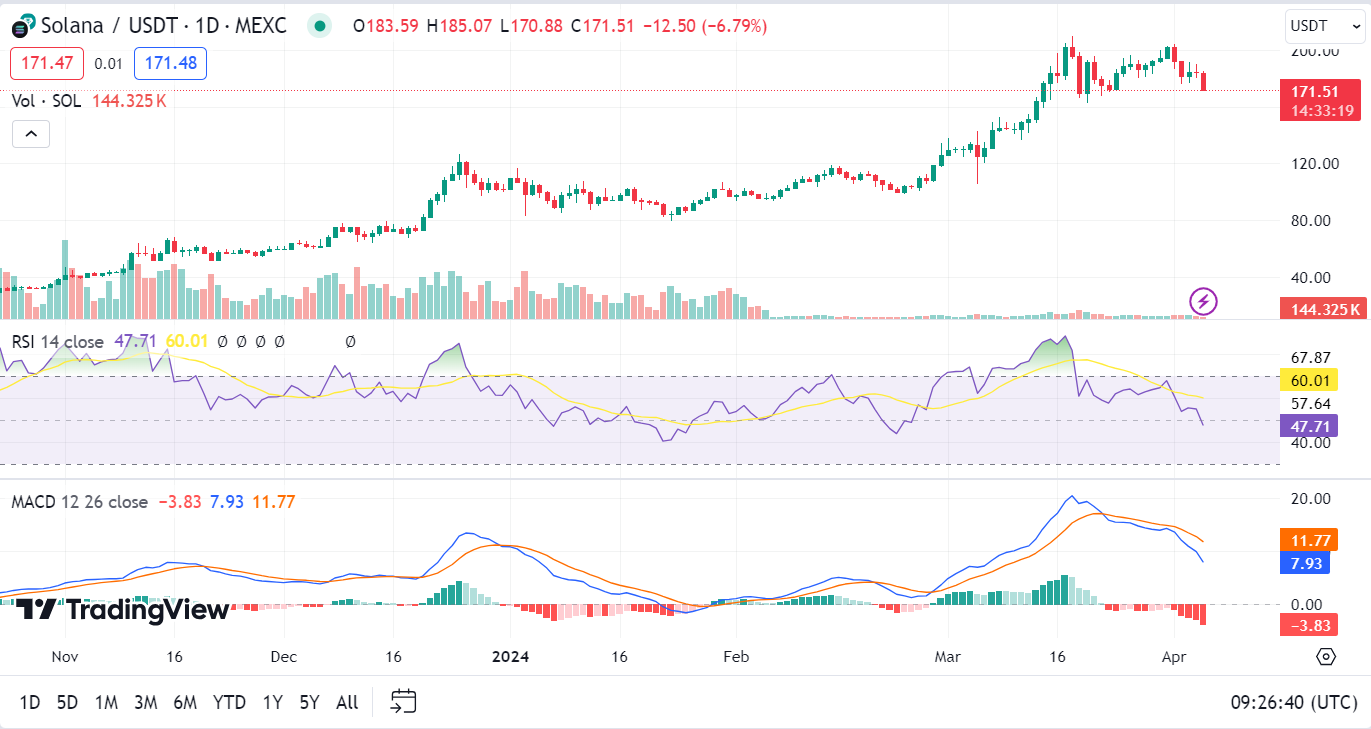
Amidst the fluctuating prices and trading volumes, Solana currently maintains a price of $172.98 with a 24-hour trading volume exceeding billions. Despite a recent downturn of 6.86%, Solana’s 1-Day Relative Strength Index (RSI) hovers around 48.13, indicating a neutral stance between overbought and oversold territories.
Furthermore, the short-term trend appears slightly bullish as the current price remains above both the 50 and 100 Exponential Moving Averages (EMA). However, the long-term outlook remains bearish, with the price still trailing below the 200 EMA, suggesting potential challenges ahead.
On the other hand, EPIK Prime, with a current price of $0.015028 and a 24-hour trading volume of $440,518, demonstrates a contrasting yet complementary narrative. Despite a modest 5.77% increase within the last 24 hours, EPIK’s 1-Day RSI sits at 53.65, signaling a neutral sentiment among traders.
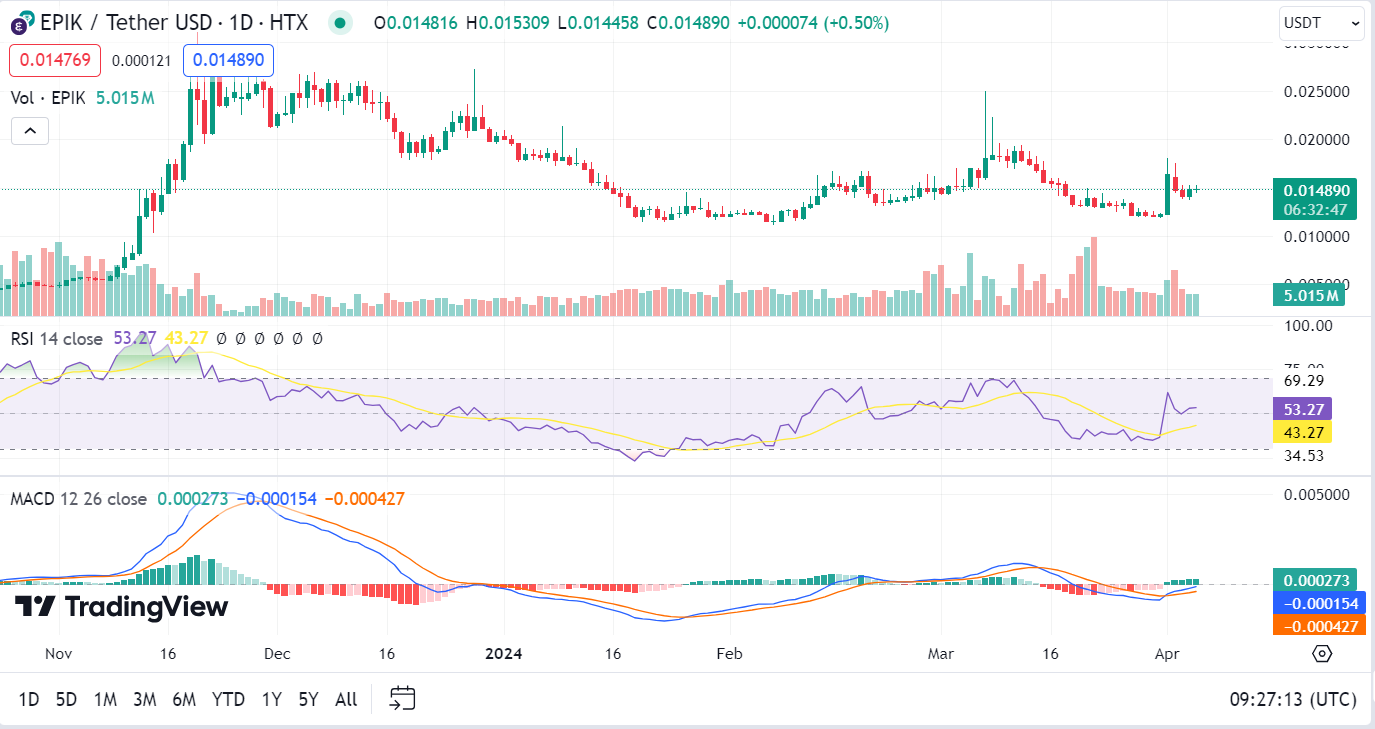
Additionally, the moving averages hint at a marginal upward trend, albeit with potential resistance at the 200 EMA level. Notably, the 1-Day Moving Average Convergence Divergence (MACD) indicates a potential bearish signal in the short term, highlighting the intricacies of navigating cryptocurrency markets.


