Ethereum Bear Breakdown Risk Grows Despite Accumulation

- ETH failed to hold above $3,400 and remains below major moving averages, with momentum weakening.
- Rising open interest near $40.46 billion, with no spot demand, has increased the risk of liquidation.
- Accumulation wallets and large holders continued buying heavily during the 45% drawdown.
Ethereum is entering a decisive phase as price action weakens near key resistance levels, even as on-chain data points to one of the strongest accumulation trends seen this year. Technical charts suggest fading momentum and rising downside risk, while derivative positioning adds to near-term caution.
Breakout Attempt Fails at Key Resistance
According to the daily chart, the token briefly moved above a descending trendline that had capped upside since early October. That move carried ETH into the $3,355 to $3,497 zone, where previous support near $3,400 turned into resistance. However, the advance stalled quickly, and the price retreated soon after.
At the time of writing, Ethereum was trading above $3,100. It remains below both the 100-day and 200-day moving averages, which sit above $3,500. Regardless, the broader structure has not shifted despite the earlier trendline break.
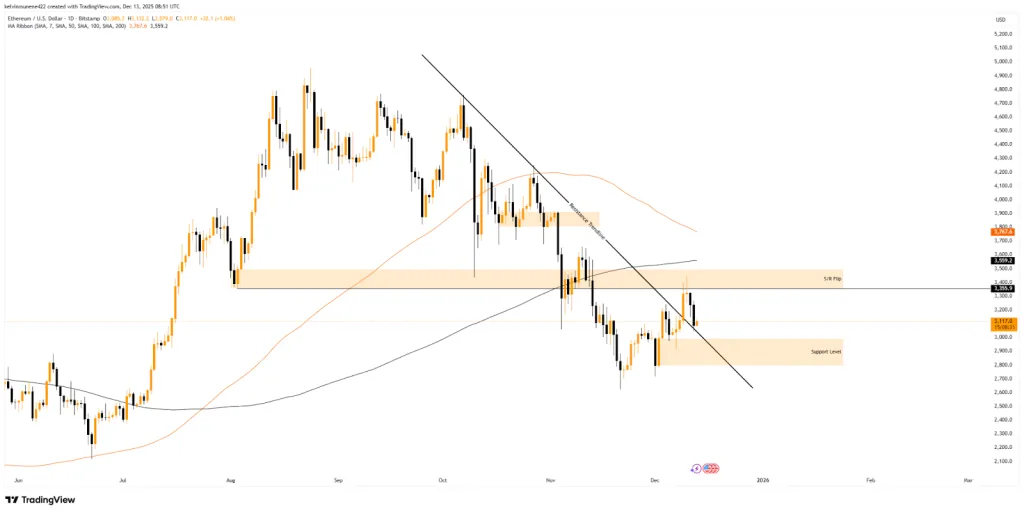
Source: TradingView
Daily price data shows repeated rejection from the same area that limited gains in early November. If selling pressure continues, traders are watching the $2,900 level, which aligns with a previously identified bullish order block and the former trendline.
Lower Time Frames Show Weakening Momentum
Besides, short-term charts show similar behavior. On the four-hour timeframe, Ethereum broke above the bearish trendline but met immediate resistance near $3,400. Price fell back below $3,300 soon after.
Consequently, the $3,100 to $3,200 area has acted as near-term support, though price action has been uneven. A long upper wick from the recent high suggests limited follow-through from buyers. A break below this zone could open a move toward $2,950 to $2,900.
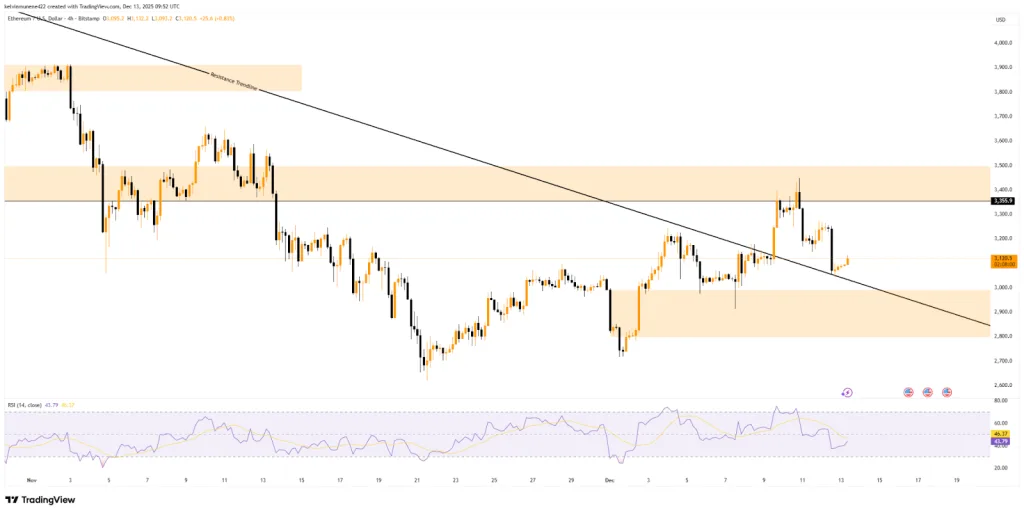
Source: TradingView
Similarly, momentum indicators have cooled. The four-hour relative strength index has fallen to around 43 after reaching overbought levels earlier in the move. This points to weakening price strength, with ETH still some distance from levels typically associated with oversold conditions.
Chart Signals and Leverage Add to Market Caution
Derivatives data adds another layer of caution. Ethereum’s open interest has been climbing gradually and now sits near $40.46 billion, while the price has stabilized around the $3,100 area. Historically, periods where open interest rises without a matching price expansion have preceded sharp directional moves.
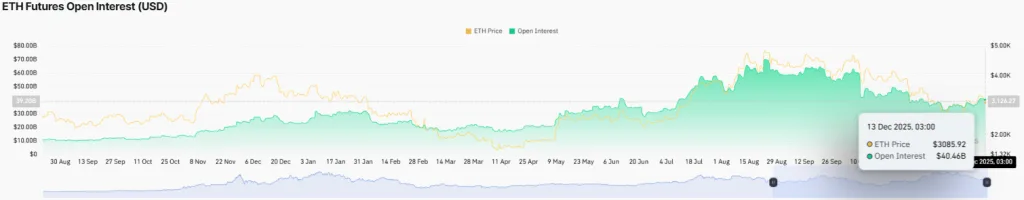
Source: CoinGlass
This setup reflects growing speculative exposure without explicit confirmation from spot demand. In prior instances, similar conditions led to liquidation-driven volatility once the price broke key levels. While direction remains uncertain, the imbalance increases short-term risk.
Notably, technical caution increased after analyst Ali Martinez highlighted a potential bearish flag on the 12-hour ETH/USDT chart. The structure shows Ethereum moving within an upward-sloping channel following a sharp decline.
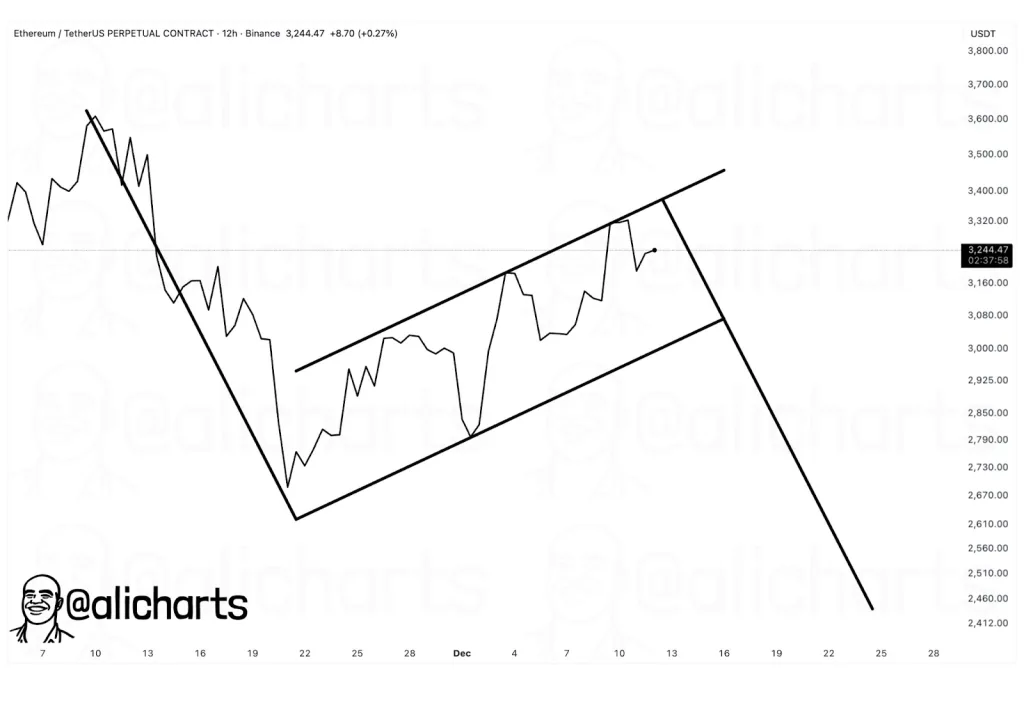
Source: X
Ethereum was trading near $3,240 when the pattern was noted. However, rejection at the channel’s upper boundary has already led to renewed selling pressure. A confirmed break below the lower trendline would imply a measured move of about 25%, aligning with Martinez’s downside projections near $2,400.
Related: SEI Slides Despite Partnership News as Analysts Target $0.22 Recovery
Accumulation Builds Despite Price Drawdown
In contrast to the weakening technical structure, on-chain metrics reveal aggressive accumulation. CryptoQuant data show that accumulation addresses added 3.24 million ETH in November, marking the most significant monthly inflow for this group in 2025.
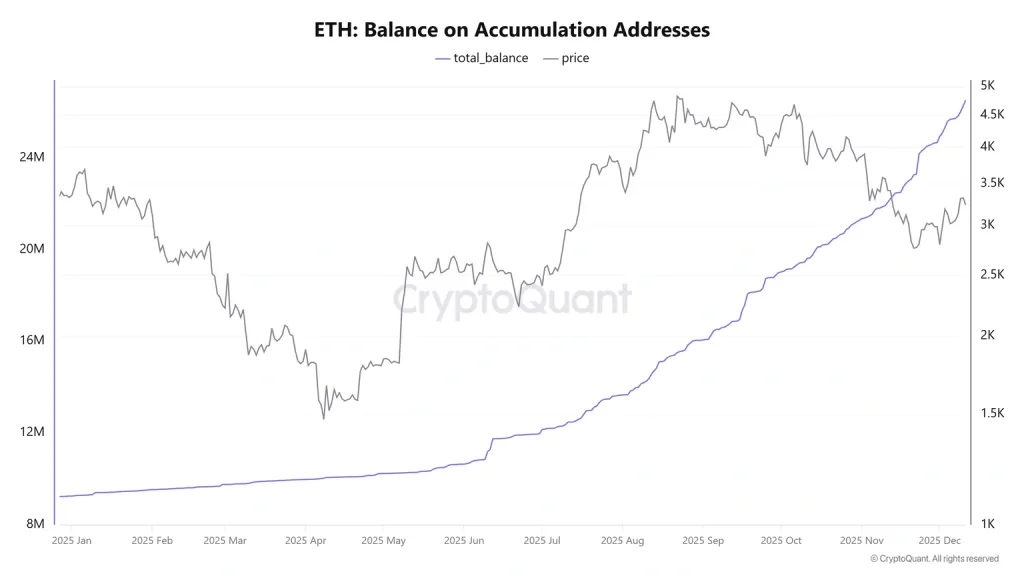
Source: CryptoQuant
These addresses, defined by a lack of selling history, continued to buy into December, with inflows exceeding 1.6 million ETH so far. The buying activity coincided with Ethereum’s steep drawdown. ETH fell nearly 45% from a high of $4,758 on October 7 to a low of $2,621 on November 21.
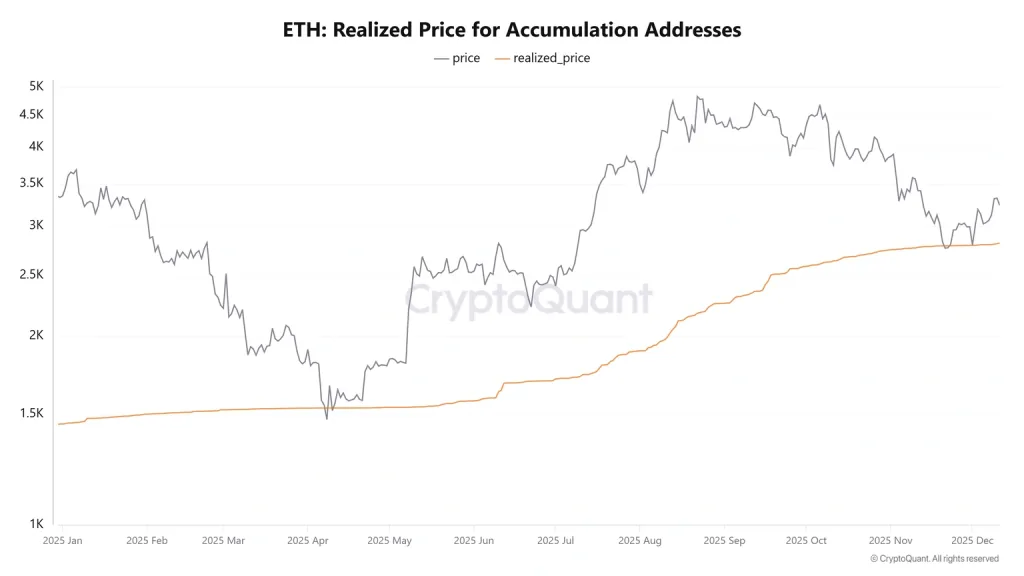
Source: CryptoQuant
CryptoQuant data shows Ethereum bounced near the average cost basis of accumulation addresses on November 21 and again on December 1. Whales showed similar behavior. Wallets holding between 10,000 and 100,000 ETH added roughly 1.4 million ETH in November.
After a brief period of distribution last week, the group resumed buying, adding about 480,000 ETH between Sunday and Thursday. Overall, Ethereum remains at a sensitive juncture, with weakening technical signals colliding with substantial on-chain accumulation.
Price action is struggling near resistance, derivative positioning points to elevated risk, and market participants are closely watching whether key support levels can hold as opposing forces continue to shape near-term direction.