
Ethereum Classic (ETC) price analysis indicates a possibility of correction after a decent increment in the price. ETC is an open-source, blockchain-based platform having intelligent contract functionality.
ETC fell 1.41% in the past 24 hours. The price hovers near the short-term resistance zone near $20.50-$20.60. And, if drops below $20.00, the asset could further slip toward $18.35, the daily price chart shows.
ETC Price Retrace Below the Critical Resistance Zone
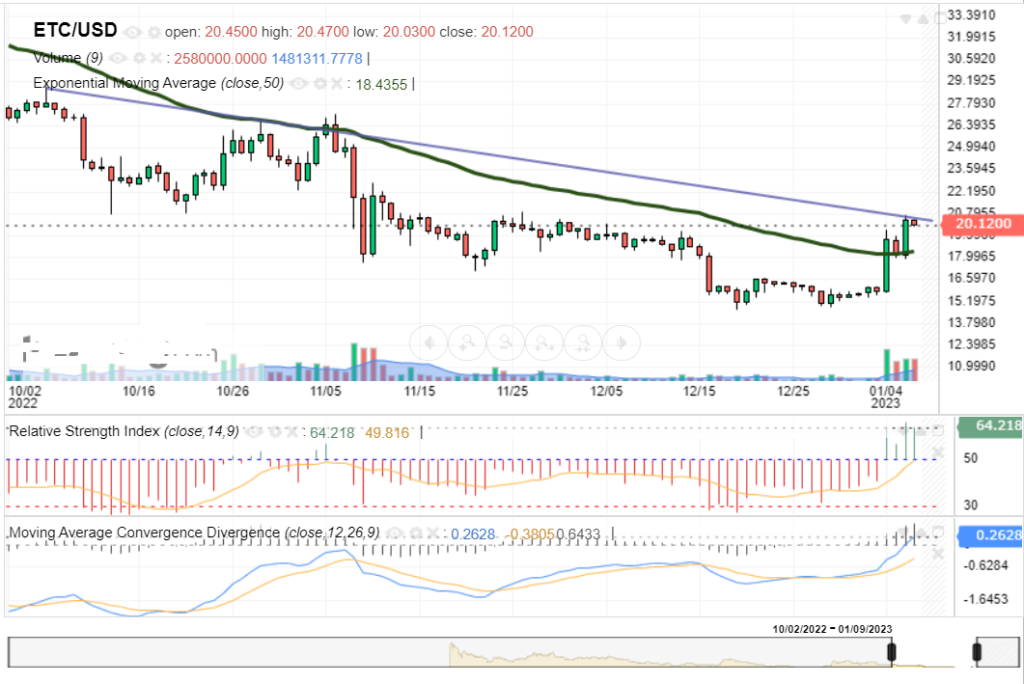
On the daily chart, the Ethereum Classic price analysis is bearish, near the descending trendline that extends from the high of $45.70 made on August 13. The token attempted to breach the bearish trendline between November 5-November 7. But, the bulls failed to sustain the gains and retraced nearly 40% to test the low of $14.76.
This level forms an interim support zone and the price bunce back nearly 20% in the past few sessions. But, the gains took a pause in today’s trading session as the bulls met with the critical resistance zone.
Apart from the technical indicators, the price jump is also linked to whale activity. A pivot in Ethereum Classic’s hash rate had an impact on ETC’s price action.
But, now the upside seems limited with the stretched market conditions. A minor pullback is on the cards. As mentioned earlier, if the price drops below the 50-day EMA, then gates for lower levels would be open further.
On the other hand, sustained buying pressure could breach the negative trend line and set the stage for another price hike in the short term. If that occurs, the next destination for bulls would be $22.80.
Technical Indicators:
RSI: The daily (14) RSI reads at 64.
MACD: The MACD holds above the midline with an increased bullish histogram.