
Ethereum Classic, in the wake of market speculation about a potential Ethereum ETF, has witnessed a notable shift in its trading pattern. Consequently, the asset has broken through the 618 golden ratio, marking a significant turn in its market trajectory. This development places Ethereum Classic at a crucial juncture, teetering on a major support and resistance flip.
CryptoBusy, a renowned crypto analyst, recently shared insights on X, emphasizing Ethereum Classic’s significant market shift.
The crypto community has been abuzz with talks of an Ethereum ETF. This speculation has fueled a bullish sentiment in the market. Ethereum Classic, in response, has shown remarkable resilience and growth. The rise above the 0.5 Fibonacci level was particularly noteworthy. It signaled a robust market response to the unfolding events.
Currently, Ethereum Classic finds itself at a crucial juncture. The price rests on a major key level, supporting and resisting. This position is critical for traders and investors alike. Moreover, it indicates a potential point for a market reaction. Market analysts closely watch this level to gauge future movements.
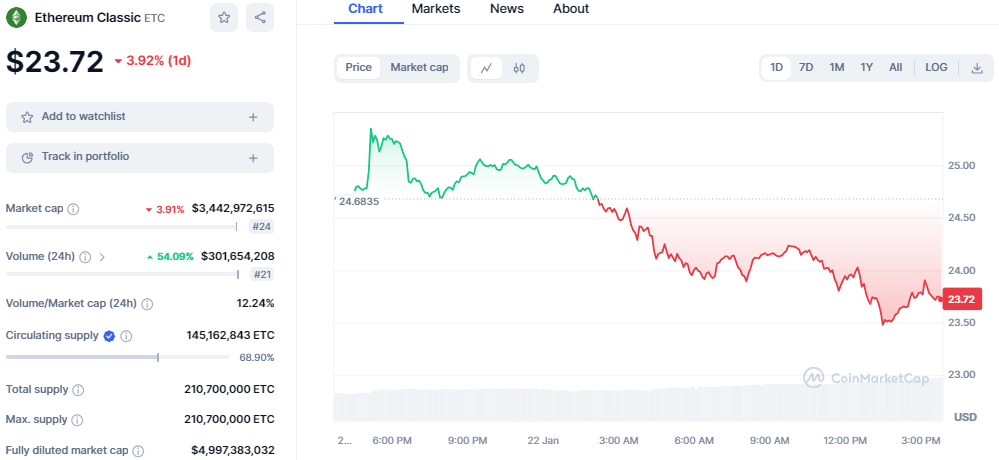
As of this writing, ETC is trading on a bearish note following the wide market dip. ETC has been trading on a downtrend for the past week since failing to hold above the $27 key level. Today, ETC dropped below the $25 mark, creating a new support at the $23.40 level. Currently, ETC’s price is set at $23.72, showing a decrease of over 3% in the past 24 hours.
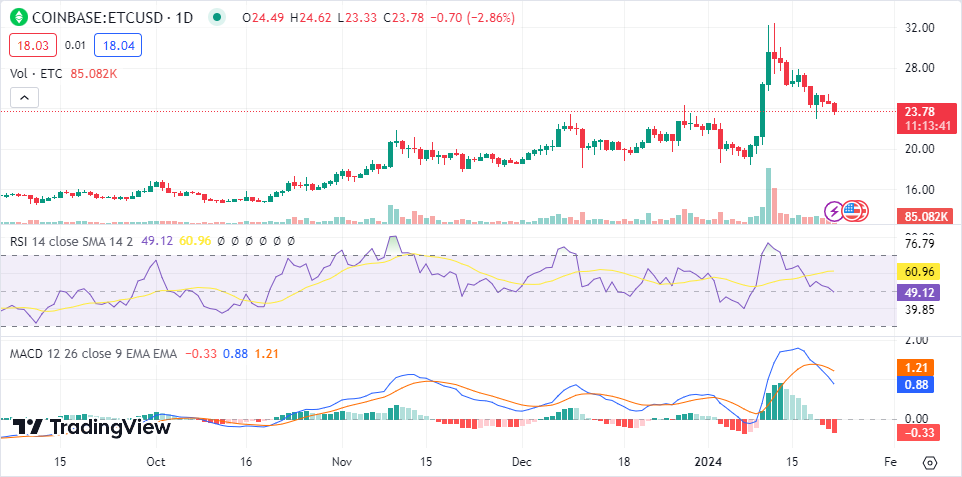
Technical indicators on the daily chart display a bearish bias as they head toward the south, indicating a bearish reversal. The Relative Strength Index (RSI) changed its trendline a few weeks ago and has dropped below the neutral index of 50 at 49, suggesting a strong downtrend in play. The Moving Average Convergence Divergence (MACD) indicator shows an increase in the bearish trend as the MACD line drops below the signal line, and the histogram prints red bars.
In conclusion, Ethereum Classic’s recent market performance presents a critical moment for the cryptocurrency. Its response to the Ethereum ETF speculation and the current positioning at a major support-resistance level are pivotal. These factors will likely shape ETC’s market behavior in the coming period.