
Exchange Flow indicators and transactions on Ethereum’s blockchain are powerful tools for identifying tops and bottoms in the Ethereum price. This article will explain two of these essential metrics: Exchange Inflow (Mean, MA7) and Tokens Transferred USD (Total).
Exchange Inflow measures investors’ deposits in exchanges for potential sales. This indicates the inflow of Ethereum tokens that could be sold and is an important metric for determining pricing tops. On the other hand, Tokens Transferred USD (Total) measures the total amount of tokens transferred in this window, calculated in USD. When this metric decreases, it can indicate an impending price drop as demand weakens.
By comparing these two metrics to the ETH-USD price, investors can gain a better understanding of when to buy or sell Ethereum tokens. It is important for traders and investors alike to stay informed about coin flow as it has a direct impact on Ethereum’s price movements.
Additionally, tracking Exchange Flow indicators and transactions can help alert users to potential price manipulation and other market forces. By using the insights gained from these metrics, traders can gain an edge in making profitable trades.
In conclusion, tracking Exchange Flow indicators and transactions is key to understanding Ethereum’s price movements. Monitoring these metrics regularly can help investors make informed decisions about when to buy or sell Ethereum tokens for maximum profitability. The insights provided by these metrics can give users an edge in the ever-changing cryptocurrency market.
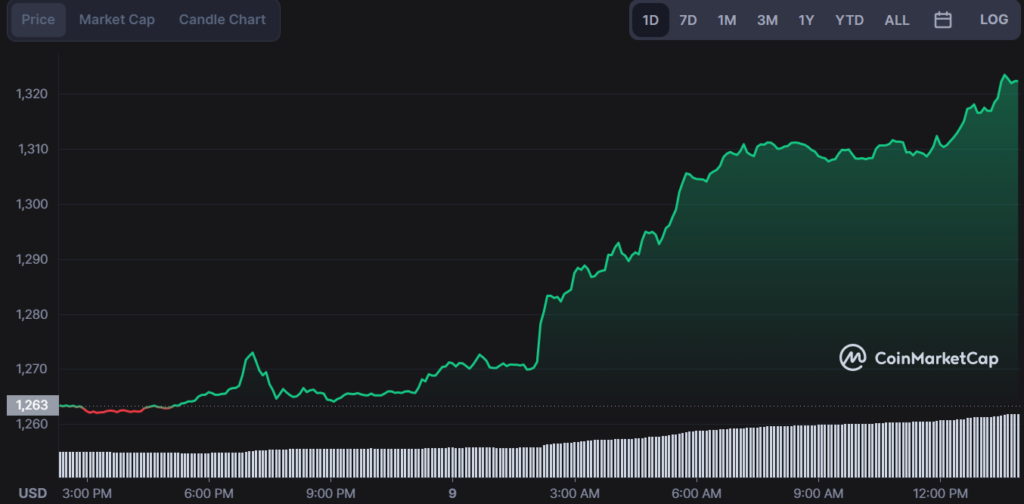
Ethereum Price Analysis Today
Ethereum has climbed to a new all-time high today, reaching $1,797. The second-largest cryptocurrency by market cap has been in an uptrend since the beginning of this week and is up 4.68% over the past 24 hours.
Strong technical indicators on the daily chart are in support of the bulls, and the price could extend its gains in the coming days. The relative strength index (RSI) is at 61, indicating that Ethereum still has more room for growth.
The 24-hour trading volume also remains strong at $6,433,984,093, which is an encouraging sign of liquidity in the market. The Stochastic RSI suggests that the bulls may have a bit of a pullback in the near future, but overall the trend looks bullish.