Ethereum’s 8-Year Convergence Suggests 2026 Altcoin Season Could Top 2021

- Ethereum’s ETH/BTC chart shows an eight-year squeeze nearing a decisive breakout zone
- Analysts say longer non-BTC exchange volume trends now rival and may exceed 2021 strength
- A recurring 3–4 year altcoin cycle and oversold Stoch RSI are back in focus for 2026
A renewed debate over the next phase of the crypto market has emerged after two separate chart-based analyses pointed to 2026 as a possible turning point for alternative digital assets. At the center of that discussion is the ETH/BTC trading pair, where analyst CW identified an eight-year convergence pattern that has been forming since mid-2017.
In parallel, trader Trader Tardigrade highlighted a repeating cycle in the broader altcoin market that has historically appeared every three to four years. Taken together, the data do not confirm a breakout has occurred, but it does show why analysts are closely watching the current setup.
CW’s work focuses on a long compression structure in the ETH/BTC chart, while Trader Tardigrade’s research tracks the TOTAL altcoin market cap, labeled OTHERS, on the monthly timeframe. Both analyses rely on historical market structure, price behavior, and momentum indicators rather than narrative-driven assumptions.
ETH/BTC Compression Reaches a Critical Stage
CW’s analysis centers on the weekly ETH/BTC chart, which shows a large descending triangle that began after the pair peaked near 0.16. Since then, the chart has compressed between a falling resistance line and a horizontal support area around 0.020.
During the 2021 bull market, the pair rebounded strongly but still failed to break above the upper trendline, after which it moved sharply lower again. The chart now places ETH/BTC near the narrow end of that structure, around the 0.029 region.
That matters because the distance between resistance and support has steadily tightened for nearly eight years. In technical terms, this indicates a mature compression phase, with price action approaching the apex of the pattern. CW’s report presents that setup as a measurable shift in market structure rather than a short-term trading signal.
Why Analysts Are Comparing 2026 With 2021
Essentially, CW’s broader argument is that the current setup differs from 2021 in duration and market participation. In a previous post, he referenced CryptoQuant data tracking the centralized exchange volume ratio of non-BTC assets versus Bitcoin, excluding stablecoins.
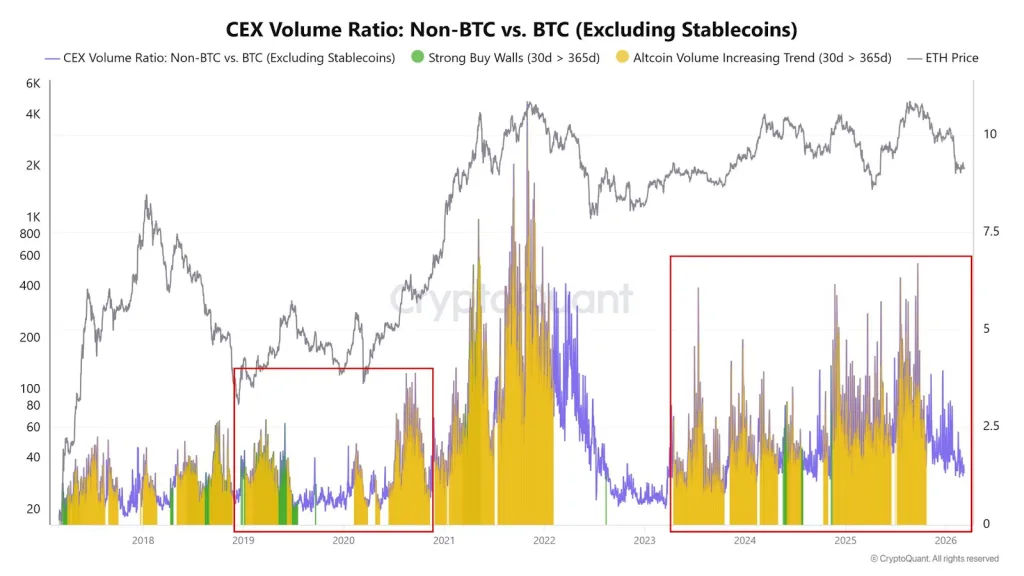
The comparison showed that in both the current period and the 2021 cycle, non-BTC trading activity on centralized exchanges remained above Bitcoin’s trading volume. However, the key difference, according to the chart, is persistence. CW noted that this elevated trading activity has lasted longer in 2026 than it did during the 2021 altcoin season.
That does not prove a stronger rally will follow, but it does provide a statistical basis for why some analysts believe the market structure is more extended and more broadly supported than it was in the prior cycle.
Related: XRP Holds Key Support as Traders Sit on $50.8B Unrealized Loss
Broader Altcoin Market Data Adds Context
Similarly, a separate analysis from Trader Tardigrade adds another layer to the discussion. Using the monthly OTHERS chart, he identified a repeating pattern in which major rallies appeared in 2015, 2018, and 2022. Those cycles, as shown on the chart, delivered gains of roughly +231,000%, +8,000%, and +500%, respectively.
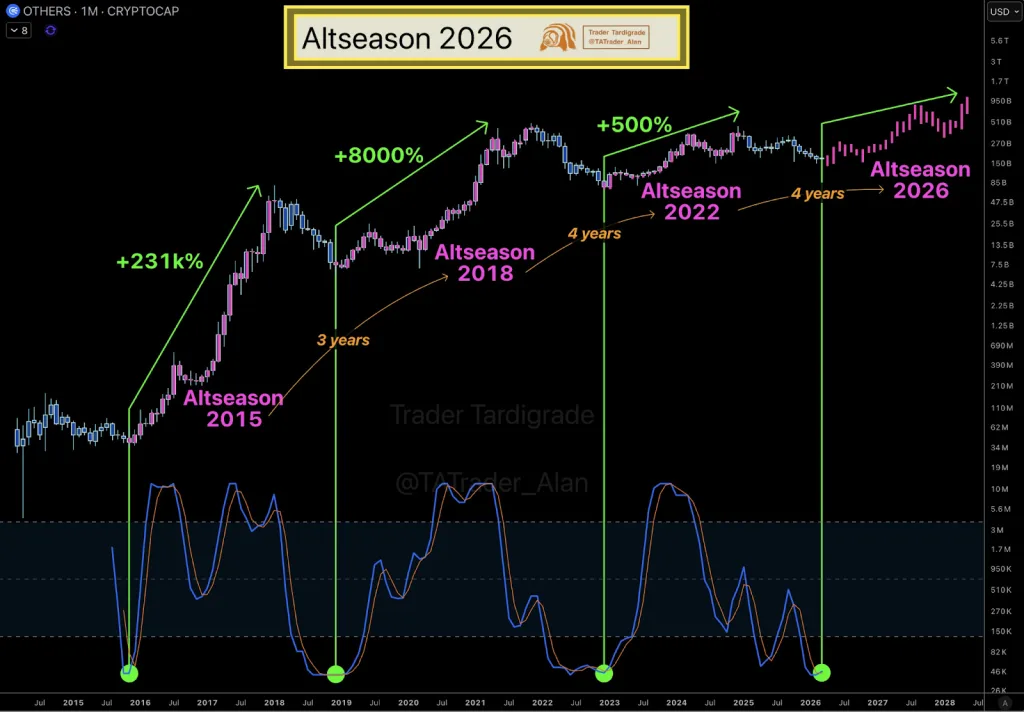
The latest reading also shows the Stochastic RSI in oversold territory, a condition that had appeared before earlier upward moves in the same cycle sequence. This places the current market in a historically important momentum zone.
For now, the evidence being cited remains technical and volume-based: an eight-year ETH/BTC convergence, a longer-running non-BTC exchange volume trend, and a cyclical market-cap pattern that has again drawn attention to the possibility of an altcoin season led by Ethereum.