HBAR Price Tests $0.20 Support as Market Pressure Mounts, Will it Hold?

- HBAR drops 5 percent this week as price retests the $0.21 to $0.20 support range.
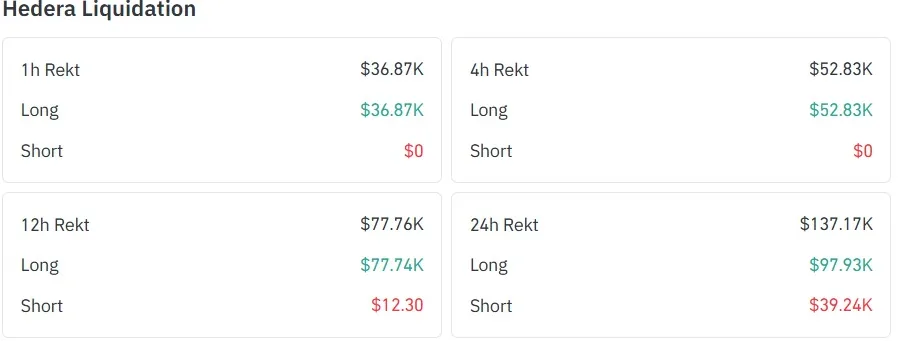
- Long traders face pressure with $97.9K liquidated as downside momentum builds.
- RSI and MACD hint that the bearish grip is fading, opening room for a possible recovery.
Hedera’s native token, HBAR, is weathering another wave of bearish momentum, edging closer to a decisive support area. Trading at $0.2127 at press time, the token has lost nearly 2% in the past 24 hours and sits about 5% lower on the week.
The decline has brought HBAR back into the $0.21 to $0.20 range, a zone traders widely view as critical support. Market data underscores the tension, showing pressure clashing with heightened activity.
According to CoinMarketCap, HBAR’s total market capitalization has slipped to $9.01 billion, down 1.51% on the day. In contrast, trading activity has spiked, with 24-hour volume climbing to $257.8 million. This surge reflects increased positioning on both sides, further amplified by liquidation flows.
Over the past day, $137,170 worth of positions were liquidated. Long traders absorbed the bulk of the damage, losing $97,930, while short traders accounted for $39,240. The imbalance shows longs under strain, with forced exits adding further downside pressure.
The situation leaves HBAR finely balanced between resilience and vulnerability. With volumes surging and liquidation flows pressing against bullish momentum, the $0.21 to $0.20 bracket has become the focal zone for market watchers. The central question now is simple but critical: Will this support stand firm or give way under pressure?
Amid this pressure, new on-chain developments have added a bullish undertone. Contract addresses linked to BlackRock, State Street, Aberdeen, and Libre have been listed on RWA_xyz, sparking speculation that billions in tokenized assets could eventually flow through Hedera’s network. This institutional tie-in strengthens Hedera’s long-term fundamentals even as traders grapple with short-term volatility.
HBAR’s $0.20 Support Tested: Break or Bounce Ahead?
In early September, HBAR broke out of a falling wedge pattern near $0.23, a move many traders considered a bullish reversal signal. The token climbed to $0.25, delivering a 10% gain. But momentum stalled as the $0.25–$0.24 resistance zone, aligned with the 50% Fibonacci retracement, stopped the advance and dragged the token back to $0.20.
At this point, HBAR reconnected with the wedge’s resistance trendline, now flipped into a support zone between $0.21 and $0.20. Buyers stepped in, lifting the token price upward and forming a retest pattern.
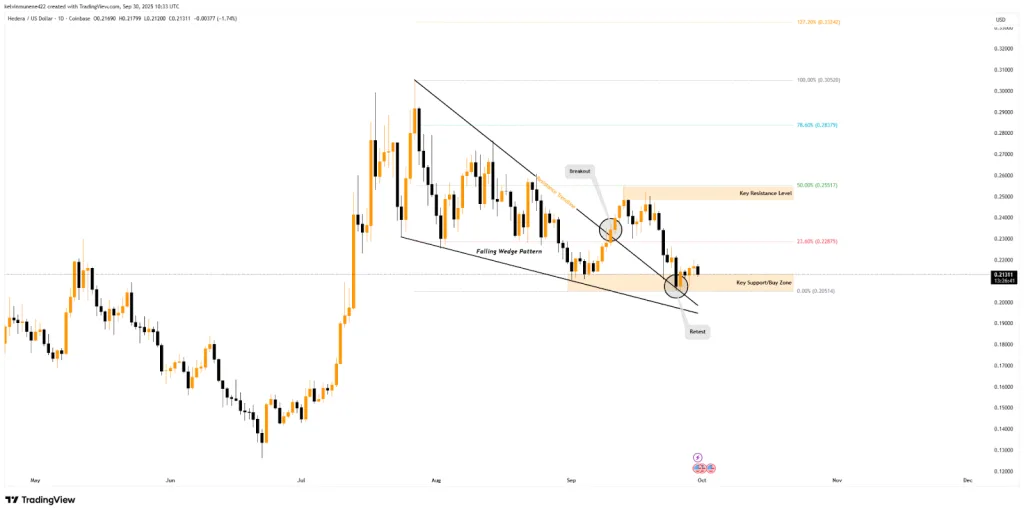
Traders often view breakouts followed by retests as precursors to bullish continuation. For HBAR, this combination has sharpened focus on the $0.21–$0.20 zone as a potential long-entry range.
If buyers defend this level, the token could first target the 23.60% Fibonacci retracement near $0.22. Clearing that zone could reopen the path to $0.25–$0.24 resistance, with further upside possible toward $0.28 or even $0.30, last seen in July.
Still, the bullish outlook depends entirely on stability above the support level. A failure to hold above $0.20–$0.21 would hand momentum back to sellers, dragging HBAR deeper below $0.20 and potentially erasing gains since September.
Related: Aster Tops Perpetual DEX Fee Charts with $28M in 24 Hours
Momentum Indicators Signal Market in Transition
From a technical perspective, indicators suggest a market in flux. The Relative Strength Index (RSI) stands at 40.24, which suggests a bearish trend. But the upward slope from a low of 34.86 points indicates weakening sell pressure and room for recovery.
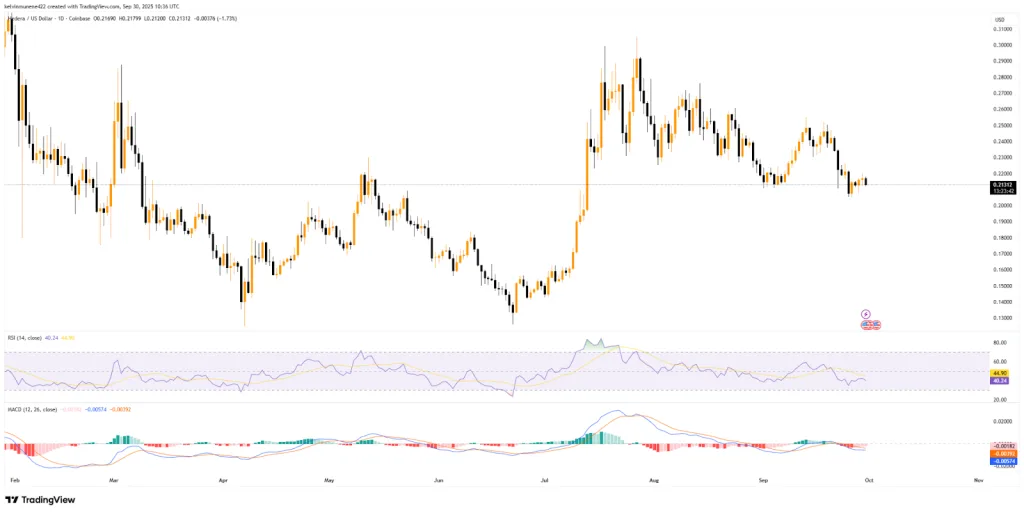
The Moving Average Convergence Divergence (MACD) also reflects this shift. Its line remains negative at –0.00574, below the signal line at –0.00392, but the narrowing gap signals waning bearish strength. At the same time, the histogram’s shrinking red bars are moving closer to the zero line, often a precursor to a momentum flip.
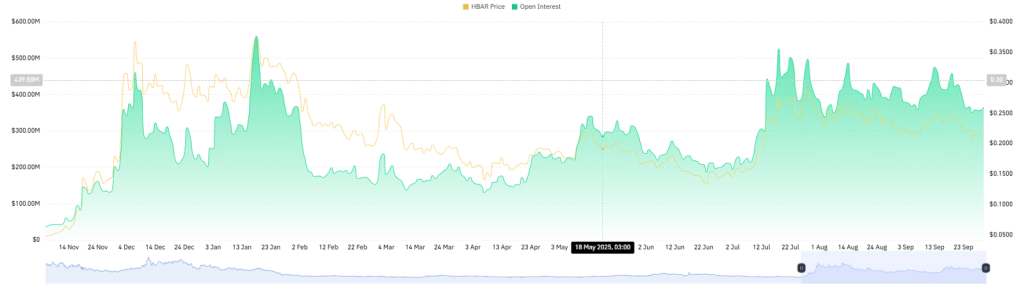
Meanwhile, open interest has flattened at $365 million, indicating muted volatility and a lack of appetite for new positions in derivatives markets. This sideways action suggests consolidation, with traders waiting for stronger cues before committing to directional bets.
Conclusion
HBAR stands at a crossroads, balancing persistent bearish pressure with signs of recovery. While liquidations and open interest highlight ongoing weakness, RSI and MACD suggest fading sell dominance and the possibility of a rebound. The $0.21 to $0.20 support zone remains the decisive battleground. Whether it breaks lower or sparks a reversal, upcoming sessions will determine the token’s next move.