Hedera (HBAR) has seen a recent decline in its price, trading at $0.066625 with a 24-hour volume of $40,180,754, at press time. Over the past day, the cryptocurrency has experienced a decrease of 2.38%, reflecting a bearish trend in its price movement.
AlertTrade, a trading view analyst, chart analysis reveals a distinct descending channel pattern that has formed and completed recently. This pattern typically indicates a downward trajectory in price, suggesting a prevailing bearish sentiment among traders. The price has consistently adhered to this downward-sloping channel, reinforcing the bearish trend observed.
Key support and resistance levels play crucial roles in understanding potential price movements. At present, the $0.0650 level has repeatedly acted as a support, as evidenced by multiple instances where the price rebounded upon reaching this point.
Hedera Tops in Development Activities Surpassing Optimism and CardanoAnother notable support level is at $0.0600, where buying interest tends to emerge during price declines. On the flip side, resistance levels such as $0.0730 and $0.0800 pose barriers where selling pressure often intensifies. This could hinder upward movements.
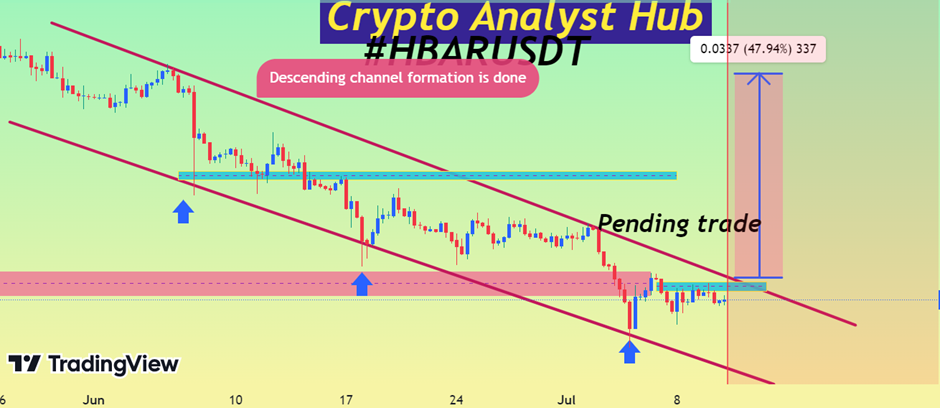
Currently, a pending trade setup is indicated on the chart. This setup suggests that if the price manages to break above the descending channel, there could be potential for a bullish reversal.
Traders are eyeing a move towards the next resistance levels, particularly targeting a substantial 47.94% increase from the current levels. This target becomes viable if the price successfully breaches the descending channel and overcomes key resistance barriers.
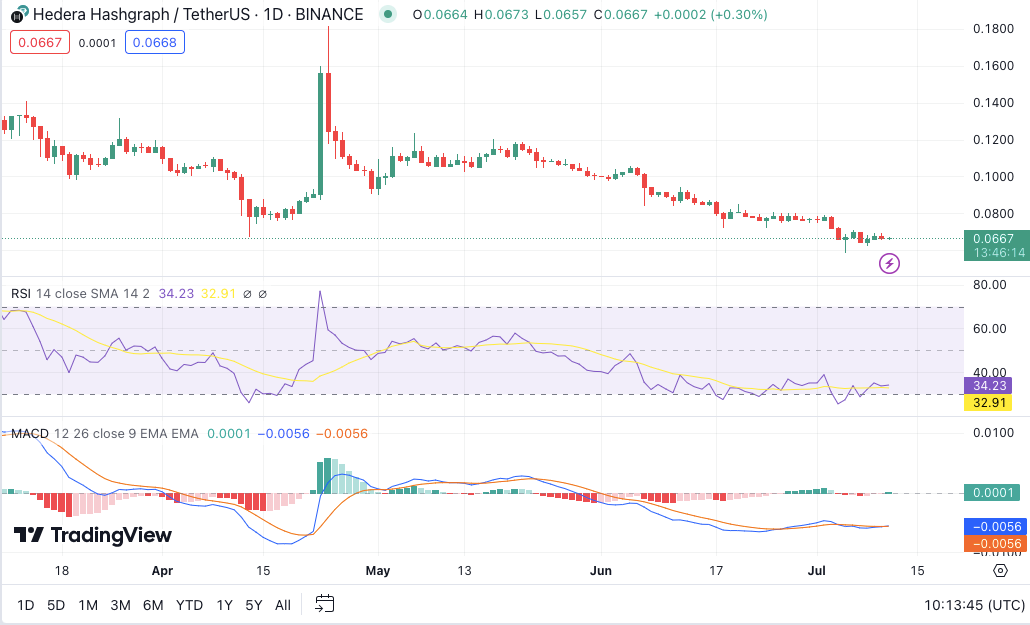
Hedera’s 1-day Relative Strength Index (RSI) stands at 34.01 is approaching the oversold threshold. This reading suggests that the asset may be primed for a potential buying opportunity, as oversold conditions often precede price rebounds.
Moreover, the 1-day Moving Average Convergence Divergence (MACD) indicator shows bullish momentum building, with the MACD line trading above the signal line. This uptick in momentum hints at a possible short-term recovery in price.