- Hitachi US joining the Hedera Council signifies a significant fusion of industrial expertise with advanced blockchain technology.
- The partnership aims to pioneer supply chain and sustainability proof-of-concepts, leveraging Hitachi’s broad industry experience.
- Hedera’s HBAR token exhibits market volatility, with technical indicators suggesting a current selling pressure and potential for price decline.
Marking a key advancement in the blockchain and industrial solutions industries, Hitachi US has formally become a member of the Hedera Council. This move forms a strategic alliance to integrate Hitachi’s profound knowledge of industrial solutions with Hedera’s innovative blockchain technology. The alliance is planned to launch the initiatives towards developing proof-of-concepts for holistic supply chain and sustainability solutions within a year.
Hitachi US, known for its diverse range of products and solutions in electronics, healthcare, energy, and the Internet of Things (IoT), is poised to bring a wealth of innovation-led industrial use cases. Their entry into the Hedera Council is crucial, hinting at leveraging their experience in developing transformative industrial applications.
Hedera, expressing excitement over this partnership, anticipates that Hitachi US’s deep industrial knowledge and technical prowess will significantly strengthen the Hedera network. Moreover, this collaboration is expected to showcase the practical, transformative potential of web3 technologies in real-world applications.
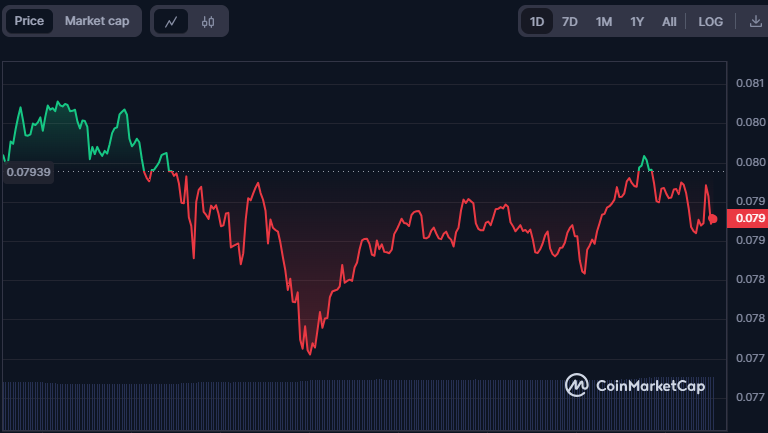
The declaration has also affected the crypto market, leading to a change in price for Hedera’s token, HBAR. At the moment, HBAR costs around $0.07847 and has dropped in the last day and over the past week with decreases of 1.75% and 0.56%, respectively. Despite these shifts, Hedera still has a high market cap of $ 2,638,745,973, showing its dominance as a cryptocurrency.
On the other hand, the technical analysis of HBAR’s price movement reveals a mixed sentiment in the market. The Chaikin Money Flow indicator in the 4-hour chart suggests selling pressure as it moves downwards at -0.11. This means that investors are more likely to dispose of their assets; thus, a fall in prices continues.
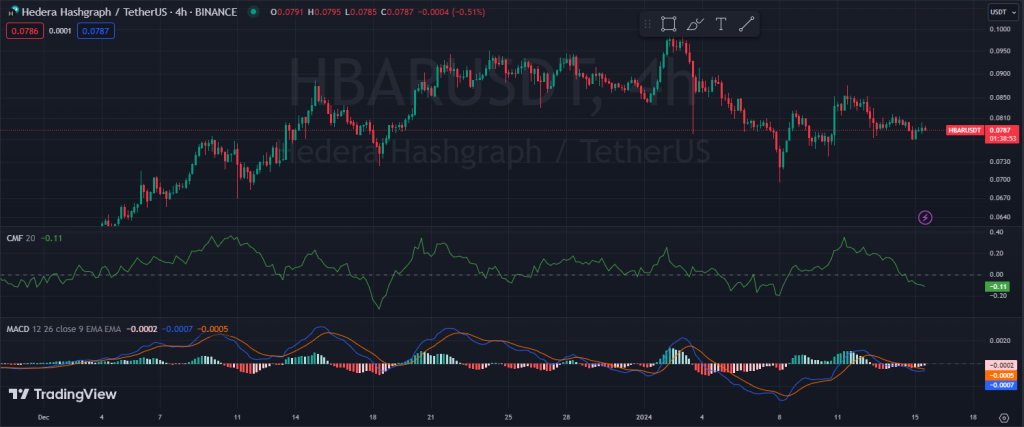
Moreover, the MACD line is below its signal in the 4-hour chart, entailing a bearish indicator. This coincides with the concept of selling pressure and strengthens the likelihood that a downward price movement would occur. Traders may use this crossover as a possible confirmation of the trend reversal and proceed with caution while making their trading decisions.