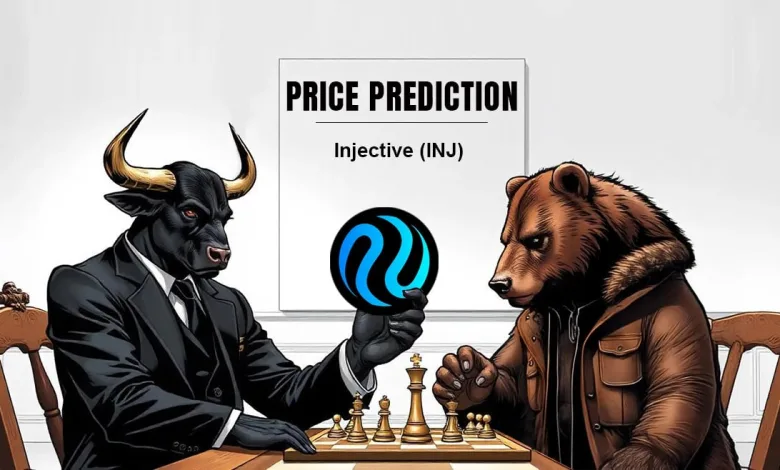
Injective Price Prediction 2025-35: Will It Hit $500 by 2035?
- Injective’s TradFi Stocks Index tokenizes assets like Apple, enhancing DeFi accessibility.
- Analysts predict an easy path to $100 for INJ, with long-term targets exceeding $200.
- Bullish INJ price prediction for 2025 ranges from $100 to $150, driven by BTC halving hype.
Injective (INJ) Overview
| Cryptocurrency | Injective |
| Ticker | INJ |
| Current Price | $15.29 |
| Price Change (30D) | -29.38% |
| Price Change (1Y) | -56.25% |
| Market Cap | $1.51 Billion |
| Circulating Supply | 98.97 Million |
| All-Time High | $52.75 |
| All-Time Low | $0.6557 |
| Total Supply | 100 Million |
What is Injective (INJ)?
Injective (INJ) is a high-performance, interoperable Layer 1 blockchain designed to redefine decentralized finance (DeFi). It facilitates cross-chain trading, derivatives, and financial applications, merging the speed and efficiency of centralized exchanges with the transparency of blockchain technology. Unlike traditional decentralized exchanges (DEXs) that rely on automated market makers (AMMs), Injective employs an order book model, providing traders with deeper liquidity and more precise price execution.
Built on the Cosmos blockchain, Injective boasts cross-chain interoperability, allowing users to trade assets from networks like Ethereum and Polkadot without incurring excessive gas fees. Its MultiVM architecture enables smart contract deployment across WASM, EVM, and SVM environments, granting developers greater flexibility in building decentralized applications.
Besides, Injective eliminates common inefficiencies in DeFi by offering plug-and-play modules, allowing developers to create financial applications effortlessly. With ultra-fast 0.64-second block times and near-zero transaction costs, it is one of the most scalable blockchain ecosystems.
At the core of the ecosystem, the INJ token plays multiple roles, including staking, governance, trading fees, and collateral for derivatives markets. The platform also employs a deflationary model, where a portion of trading fees is burned, reducing supply and increasing its value over time.
Injective’s Latest Developments: Bridging DeFi and TradFi
Injective is at the forefront of on-chain financial innovation, integrating traditional finance (TradFi) and decentralized finance (DeFi) like never before. Some of its most recent developments include:
- AI Index (AIX): A first-of-its-kind on-chain index that combines 10 leading AI tokens, such as $TAO and $FET, with 6 top AI stocks like Nvidia ($NVDA) and Palantir ($PLTR). This product democratizes access to AI investments, enabling seamless exposure to crypto and traditional AI markets.
- TradFi Stocks Index: A revolutionary product that brings hundreds of publicly traded equities on-chain for the first time. Major stocks included in the index are Amazon ($AMZN), Apple ($AAPL), Microsoft ($MSFT), and Goldman Sachs ($GS). The 24/7 trading availability and up to 25x leverage make Injective’s TradFi integration one of the most ambitious tokenization projects in the crypto space.
- Injective Hub and InjScan: Enhancing transparency and accessibility, these new platforms provide a comprehensive dashboard for staking, governance, and analytics, further empowering users to interact with the Injective ecosystem.
With major backing from Pantera Capital, Mark Cuban, and leading institutions, Injective sets a new standard for on-chain trading and financial applications.
Injective Price History
The INJ token has undergone notable price movements, shaping its market history through cycles of growth and correction. According to its monthly chart analysis, the cryptocurrency experienced a strong bullish surge in 2021, reaching a peak of $25.33, before facing a downturn close to its all-time low in 2022, mirroring broader market corrections.
However, by early 2023, the token found solid footing at a $7.28-$5.60 support level, initiating a gradual recovery. The resurgence saw INJ break out of its slump, push towards new highs, and eventually hit its all-time high around the $52 threshold by Q1 2024.
Following this high, a bearish trend channel emerged, leading to another phase of correction. The token has since moved within this downward trajectory, facing resistance at multiple levels. Currently, INJ is trading around $15.00, nearly 71% below its peak, showing the extent of the recent bearish pressure.

Despite this, a well-defined historical support zone between $7.28 and $5.60 remains a critical level where accumulation could occur. Yet, for Injective (INJ) to shift bullish, it must break out of its bearish trend channel and reclaim key resistance levels, signaling a probable trend reversal.
A move above $18–$20 signals renewed strength, targeting $26.70 (50% Fibonacci). Beyond this, INJ could test $36.00 and $44.00, with a possible retest of its all-time high. If momentum persists, the 127.2% Fibonacci extension points to $67.28 as a long-term target.
Notably, market analysts depict similar uptrend scenarios. For instance, The CryptoBull describes INJ as one of the best-looking altcoin charts, suggesting an easy path to $100 and even speculating a higher target of $200. Similarly, Captain Faibik echoes this bullish outlook, urging accumulation for the midterm with a $100 price target in sight.
On the other hand, INJ remains bearish if it fails to hold its immediate support around the 23.6% Fibonacci level at $12.82. A drop below it risks testing $7.28–$5.60 support. Losing this level could trigger a more profound decline toward its all-time low.
Related: BEAM Price Prediction 2025-35: Will It Hit $1 by 2035?
Yearly Highs and Lows of Injective
| Year | Injective Price | |
| High | Low | |
| 2024 | $52.75 | $13.521 |
| 2023 | $44.835 | $1.216 |
| 2022 | $10.083 | $1.123 |
| 2021 | $25.330 | $3.507 |
| 2020 | $5.314 | $0.6557 |
Injective Technical Analysis
The monthly chart’s Moving Average Convergence Divergence indicator is bearish, with the MACD line at 2.287, below the signal line at 3.651, highlighting growing bearish momentum in the INJ market. The MACD’s histogram chart further reinforces this scenario by printing negative red bars, indicating sustained downward momentum.

However, a bullish reversal would require the MACD line to cross above the signal line, accompanied by a shift in histogram bars from red to green. On the other hand, the Relative Strength Index is currently at 47.36, below the neutral 50 level, indicating an impending bearish momentum on the horizon.
Previously, the RSI reached 61.72 before declining, showing a loss of buying pressure. If the RSI falls below 40, it could indicate a move toward the oversold 30 conditions, potentially signaling a price bottom. Conversely, a move above 50 would suggest renewed strength in momentum.
Injective (INJ) Price Forecast Based on Fair Value Gap
The Fair Value Gaps (FVGs) on the monthly chart highlight likely price inefficiencies, with two key areas standing out. The first FVG between $13.45 and $7.91 aligns with historical price action, suggesting a strong probability of price filling this gap before establishing a support base.

The second FVG at $3.01–$1.77 corresponds to a deeper liquidity zone near the coin’s all-time low, marking an extreme case if bearish momentum persists. Currently, INJ is approaching the first FVG. This region could be a magnet for price action, as inefficiencies are often revisited before a trend shift occurs.
If the token fails to hold above $13.45, it may fill the gap between the first FVG before buyers step in. A failure to sustain this level could accelerate a decline toward the deeper $3.01–$1.77 FVG, especially if broader market conditions remain bearish.
Injective (INJ) Price Forecast Based on MA Ribbon Analysis
The MA Ribbon on the monthly chart signals a mixed trend, with Injective (INJ) trading below the 20-period MA but still above the 50-period MA. The 20-period MA stands at $22.061, acting as a key resistance level, while the 50-period MA, at $12.840, currently provides dynamic support. INJ’s price of $14.85 places it between these two levels, suggesting that it is in a consolidation phase within a broader bearish trend.

Historically, the 20-period MA has functioned as a resistance level, and INJ’s previous attempts to reclaim it have failed, reinforcing the bearish outlook. If the price remains below this level, further downside movement is possible, with the 50-period MA at $12.840 as an immediate support zone.
A break below the 50-period MA could accelerate selling pressure, increasing the likelihood of a retest of the lower support zone. Conversely, if INJ successfully reclaims the 20-period MA, it would signal renewed bullish momentum, leading to a recovery toward the upper resistance zone.
Injective (INJ) Price Forecast Based on Fib Analysis
The Fibonacci retracement tool on the monthly chart highlights key price levels, with Injective (INJ) currently trading just above the 23.6% retracement level at $12.82. This suggests that $12.82 serves as a crucial support level, and a breakdown below it could lead to further downside toward the support zone around $7.28–$5.60.

For a potential bullish reversal, INJ must reclaim the 38.2% Fibonacci level at $20.49, which aligns with the token’s monthly high. A breakout above this zone could open the path toward the 50% retracement at $26.70, a key mid-level that often dictates trend shifts. Further upside targets include the 61.8% retracement at $32.90, a critical level for determining whether INJ can sustain a long-term recovery.
If bullish momentum strengthens, the 78.6% retracement at $41.73 becomes the next major resistance before a possible retest of the all-time high around the $52 mark (100% retracement).
Injective (INJ) Price Prediction 2025
According to our price forecast, INJ is expected to experience new all-time highs driven by post-BTC halving hype, institutional adoption, and bullish sentiment. If market momentum persists, INJ could surge beyond $100, with $150 as a potential extended target before correction sets in.
Injective (INJ) Price Prediction 2026
Following the euphoria-driven peak in 2025, INJ may enter a market correction phase, similar to previous cycles. Per CryptoTale’s projections, prices could drop 50-80% as liquidity dries, with $50—$100 as key target zones amid the crypto market recession.
Injective (INJ) Price Prediction 2027
Historical trends suggest 2027 could mark the crypto market bottom as the post-crash depression phase unfolds. INJ could dip to $25-$75, revisiting previous support levels before entering a pre-halving accumulation phase, where smart investors start positioning for the next rally.
Injective (INJ) Price Prediction 2028
As BTC undergoes another halving event, Injective may see an early recovery driven by increased investor confidence and renewed institutional interest. According to CryptoTale, INJ could climb to $75-$200, exploring uncharted territories and attracting long-term holders.
Injective (INJ) Price Prediction 2029
Post-halving bullish momentum could propel INJ to new highs, mirroring its 2025 cycle. Strong DeFi expansion, AI integration, and layer-1 adoption may push prices past $150, with $300 as an extended target if bullish sentiment dominates the market.
Injective (INJ) Price Prediction 2030
By 2030, INJ may stabilize, following a period of high volatility and market correction after the 2029 peak. Instead of sharp declines, the token could range between $100 and $250, as institutional investors and long-term holders prevent extreme sell-offs, setting the stage for future growth.
Injective (INJ) Price Prediction 2031
This period could present new accumulation opportunities, resembling 2027, when INJ found its bottom before the next major cycle. If historical trends repeat, INJ may trade between $75 and $150, offering strategic entry points for investors ahead of the anticipated BTC halving in 2032.
Injective (INJ) Price Prediction 2032
With another BTC halving event, Injective may see new demand surges, driving prices into a strong uptrend. Bullish speculation, ecosystem growth, and AI-enhanced finance could push INJ toward $200-$400.
Injective (INJ) Price Prediction 2033
Post-halving euphoria could trigger an explosive rally, with INJ likely breaking into triple-digit valuations. If adoption in DeFi, TradFi tokenization, and AI finance continues expanding, $300-$500 may be a realistic forecast.
Injective (INJ) Price Prediction 2034
Following parabolic gains in 2033, a new bear market correction could unfold. Liquidity contractions and macroeconomic shifts may lead to $250-$450 pullbacks, aligning with historical crypto market downturns.
Injective (INJ) Price Prediction 2035
As the cycle resets, INJ may consolidate in preparation for the next major uptrend. As per CryptoTale analysis, $350-$500 could be reasonable, reflecting a balance between market recovery and long-term adoption trends.
Related: HYPE Price Prediction 2025-2035: Will It Hit $1000 by 2035?
FAQs
Injective (INJ) is a Layer 1 blockchain designed for DeFi, cross-chain trading, and derivatives, offering high-speed transactions, deep liquidity, and scalable decentralized finance applications.
INJ is available on Binance, Coinbase, Kraken, and KuCoin, where users can trade it for USDT, BTC, ETH, or fiat currencies via spot and derivatives markets.
INJ has strong fundamentals, institutional backing, and a deflationary model, but market volatility remains a risk, requiring thorough research and long-term investment strategies.
For security, INJ can be stored in hardware wallets (Ledger, Trezor) or software wallets like MetaMask, and Keplr, with 2FA and offline key storage for added protection.
INJ was founded by Eric Chen and Albert Chon. They built INJ to bridge DeFi and TradFi, enabling on-chain trading with institutional-level liquidity and scalability.
Injective was launched in 2020 as a Cosmos-based blockchain. Its mainnet went live in 2021, introducing advanced trading infrastructure and cross-chain financial applications.
INJ has a circulating supply of 98.97 million and a maximum supply of 100 million.
If market trends hold, INJ could exceed its $52.75 ATH and reach $100-$150 by 2025, fueled by BTC halving cycles and institutional DeFi adoption.
INJ’s all-time low was $0.6557 in 2020, during early market phases, before significant ecosystem expansion and rising demand for on-chain financial products.
Driven by BTC halving hype, INJ could reach $100-$150, setting new highs before market correction and entering a post-peak retracement phase.
As the crypto market recovers, INJ could climb to $75-$200, benefiting from DeFi expansion, cross-chain finance, and increased institutional participation.
Following market cycles, INJ could stabilize between $100 and $250 as institutional investors and long-term holders maintain liquidity amid post-peak consolidation trends.
With another BTC halving event, INJ could surge to $200-$400, fueled by blockchain scalability, AI-driven finance, and institutional trading volume.
By 2035, INJ may consolidate at $350-$500, reflecting market stability, DeFi maturity, and widespread blockchain adoption across traditional financial sectors.