
- Indicators suggest a bearish trend, signaling caution in Bitcoin’s current market.
- Historical analysis reveals a consistent pattern of Bitcoin price appreciation following halving events.
- Anticipation surrounds Bitcoin’s fourth halving in April 2024, with potential for significant growth.
Egrag Crypto, a prominent voice in the cryptocurrency space, recently shed light on Bitcoin’s performance one year ago, emphasizing the significance of both words and charts in understanding its trajectory. The commentary reflects the community’s keen interest in dissecting historical data to forecast future market trends.
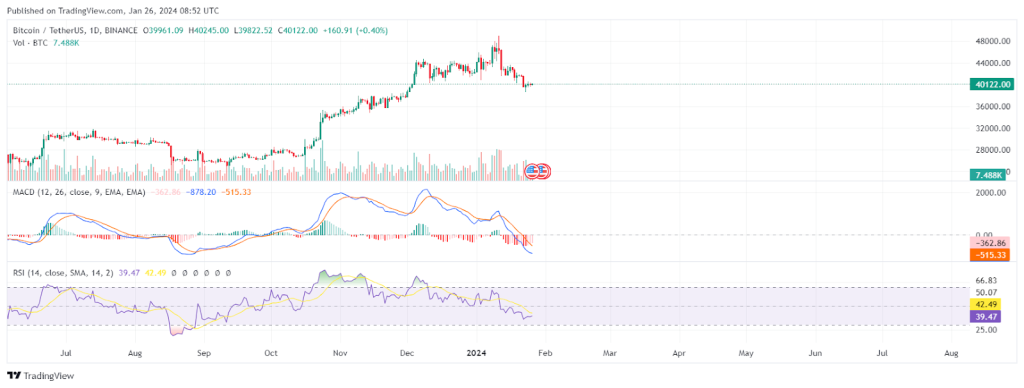
Source: TradingView
The MACD consists of two lines, the MACD line (blue) and the signal line (orange). When the MACD line crosses above the signal line, it can be a bullish signal, while a cross below can be a bearish signal. The bars represent the difference between the MACD line and the signal line. In the provided image, the MACD line is below the signal line and the histogram is negative, suggesting bearish momentum.
The RSI is plotted at the bottom and is a momentum oscillator that measures the speed and change of price movements. It oscillates between zero and 100. An RSI above 70 is considered overbought and an RSI below 30 is considered oversold. In the image, the RSI is around 42, which is neither overbought nor oversold, indicating a lack of strong momentum in either direction.
Moreover, an analysis by CryptoQuant, an analytics provider, shows a comprehensive overview of historical price patterns surrounding Bitcoin’s halving events. By examining past trends, the analysis offers valuable insights into potential future price movements, aiding investors in making informed decisions.
During previous halving events, Bitcoin has exhibited a consistent pattern of price appreciation, typically beginning a year before the halving and continuing for 12 to 16 months post-halving. This trend underscores the significance of halving events in shaping Bitcoin’s market dynamics and underscores the importance of timing for investors.
The analysis highlights Bitcoin’s impressive performance following each halving, with substantial price gains recorded in the months that followed. From the first halving in 2012 to the most recent third halving in 2020, Bitcoin’s price surged to new heights, reflecting the market’s response to reduced block rewards and the scarcity of supply.
Looking ahead to the fourth halving slated for April 2024, analysts anticipate a continuation of this trend, with Bitcoin poised for another period of significant growth. The analysis suggests that Bitcoin’s price could peak between April and August 2025, surpassing previous records and entering a bullish phase. As of the latest update, Bitcoin is priced at $41,721.35 showcasing a 4.30% growth in the last 24 hours.