
The recent dynamics of Bitcoin’s (BTC) price mirror historical sentiment cycles, an observation that has become a focal point for investors and analysts. Traditionally, these cycles transition from capitulation to hope, optimism, and belief, before a phase of anxiety characterized by a price correction.
According to Ali, a renowned blockchain figure, Bitcoin is undergoing a 20% correction, hinting at the anxiety phase of its sentiment cycle. This pattern has sparked discussions about whether this correction is a temporary setback or the beginning of a more significant downtrend.
Historically, during the last two bull cycles, Bitcoin has shown a tendency to retrace to the 50% Fibonacci level after peaking at the 78.6% Fib level. Recently, Bitcoin reached this 78.6% Fib level, raising the possibility of a correction to around $32,700, which aligns with the 50% Fibonacci retracement. This historical pattern suggests that the current 20% decline might not be the trough of the correction.
Moreover, the relationship between Bitcoin and USDT (Tether) dominance is worth noting. These two metrics often move in opposite directions and provide insights into market sentiment.
As highlighted by CryptoBusy, a market analyst, high USDT dominance indicates a risk-averse market, with investors preferring the stability of stablecoins, often a bearish signal for cryptocurrencies like Bitcoin. Conversely, low USDT dominance suggests increased risk appetite and a bullish market for volatile assets like Bitcoin.
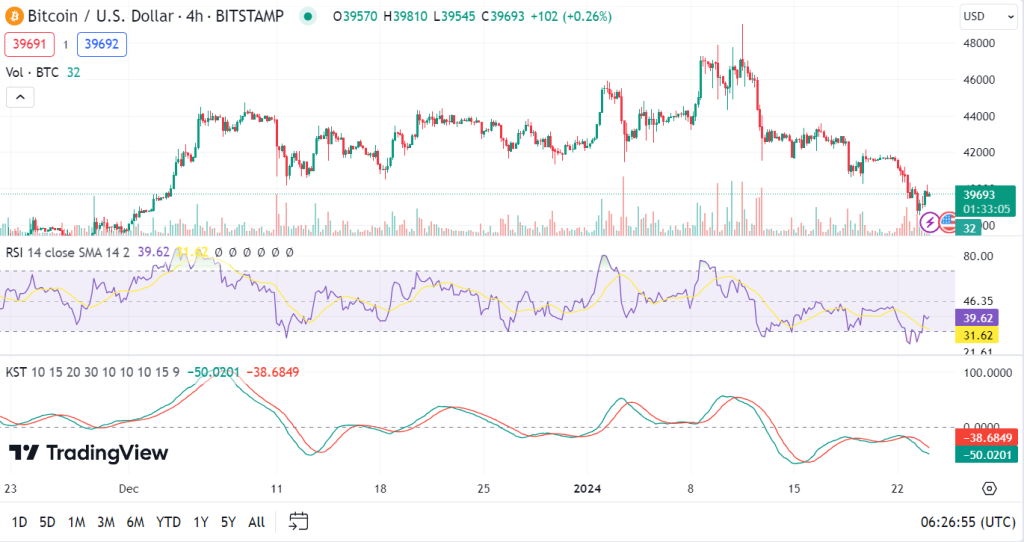
The current live price of Bitcoin is $39,717.94, with a 24-hour trading volume of $30 billion. Despite a minor 0.81% drop in the last 24 hours, the technical indicators present a more nuanced picture. The 4-hour Relative Strength Index (RSI) for Bitcoin is at 39.62, indicating a slightly oversold condition.
However, the 4-hour Moving Average Convergence Divergence (MACD) shows a bearish short-term momentum. The negative reading on the 4-hour Know Sure Thing (KST) indicator further underscores the potential for further downward movement, suggesting a weakening short-term trend for Bitcoin’s price.
While historical patterns and technical indicators suggest a potential for further decline, the unique context of each market cycle must be considered. Investors and traders should monitor these indicators closely, as they offer valuable insights into the evolving market sentiment around Bitcoin.