The BNB Smart Chain (BSC) has marked an extraordinary quarter in Q4’23. It witnessed a record-breaking 32 million transactions in a single day. Besides, its average daily transactions soared to 4.6 million, reflecting a 30% quarterly and 35% yearly growth. These figures exemplify BSC’s robust adoption and efficiency in handling high transaction volumes.
Significantly, BSC’s financial metrics displayed impressive growth across the board, and its market capitalization surged by 48% quarterly. Consequently, revenue measured in USD rose by 27%. This surge indicates a heightened interest in BSC’s offerings and growing investor confidence. Moreover, gas fees burned in BNB also grew by 21%. This development resulted in a 4% annual deflation for Q4, showcasing BSC’s effective economic strategies per a recent report by Messari, an analysis platform.
However, the growth story extends beyond mere transaction numbers. BSC’s ecosystem saw a notable increase in active validators. The count rose from 32 to 40, a 25% quarterly and 54% yearly increase. This growth stems from the successful implementation of BEP-131 and BEP-159. These enhancements foster a more robust and decentralized network, essential for BSC’s sustainability.
Additionally, in the DeFi space, Venus Protocol outshone PancakeSwap in Total Value Locked (TVL) share on BSC per Messari’s report. Venus accounted for 39% of the total share, overtaking PancakeSwap’s 37%. This shift indicates a dynamic and competitive DeFi environment within the BSC ecosystem.
Moreover, BNB Chain’s newest initiative, BNB Greenfield, adds another feather to its cap. The launch of this mainnet marks the beginning of a storage network integrated with BSC’s smart contract functionality. It’s a strategic move to create a solid foundation for Web3 and AI-focused projects, expanding BSC’s use case scenarios.
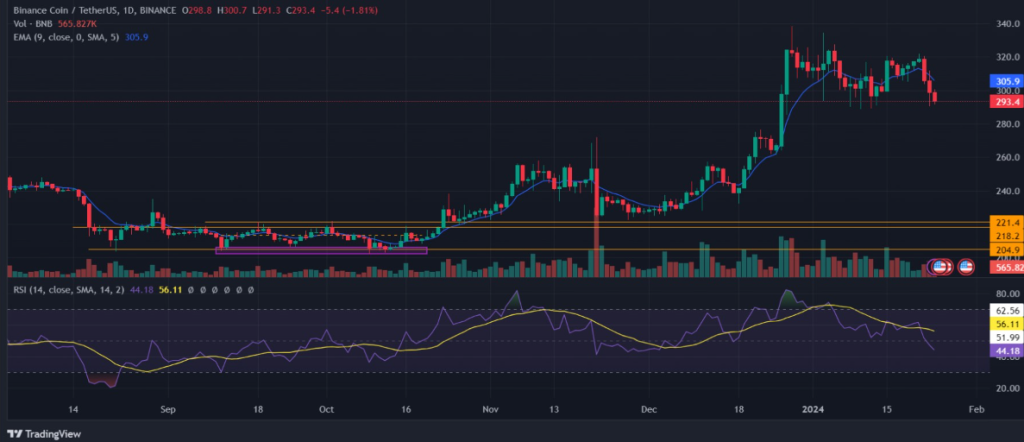
The daily price chart analysis of BNB against USDT further illustrates the market dynamics. The Japanese candlestick chart reveals an upward trend with recent corrections. Despite a slight decrease in the latest trading session, the market shows resilience. The EMA and RSI indicators suggest a cautious approach for traders, signaling potential shifts in momentum.
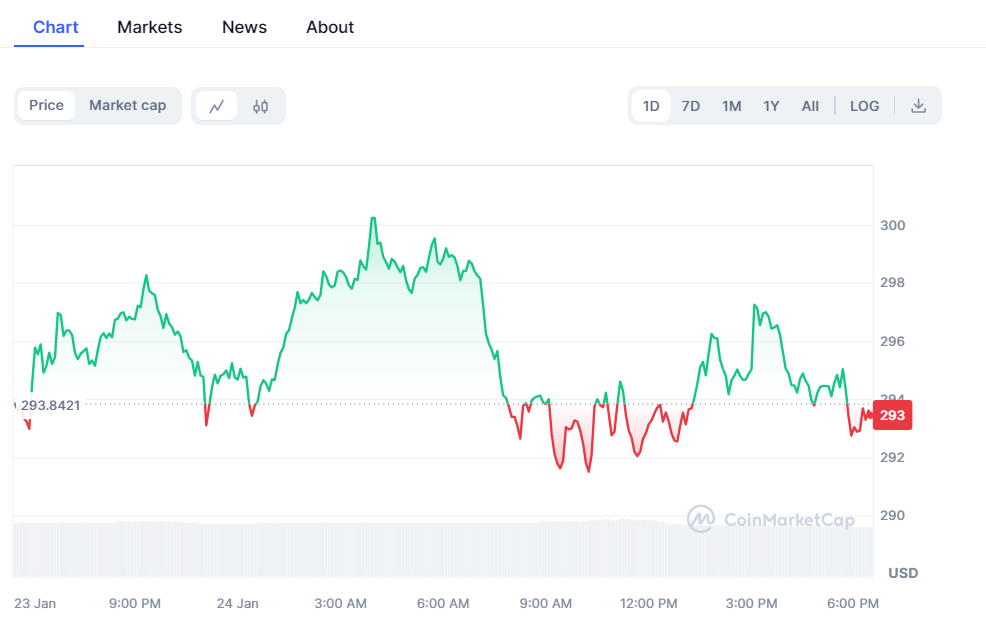
Per the recent financial data, BNB was trading at $294.79 at the press time Despite a substantial 24-hour trading volume of around $1.13 billion, BNB has dipped in value by 0.18%, highlighting the crypto market’s volatility.
BNB Chain’s Q4’23 performance heralds a new era of growth and innovation. The blend of record transaction volumes, financial growth, and strategic initiatives positions BSC as a formidable player in the blockchain space. As the third-largest Layer-1 protocol by market capitalization, BSC’s trajectory seems poised for further ascension in the competitive crypto landscape.